Bitcoin and the Square of 52 - Massive Expansion Zone ahead
The chart you are about to see is a rare chart, it’s a Square of 52. It was one of WD Gann’s most important lessons. What is most important about this zone is the considerable void in the center of the Square. And that void is like a vacuum.
The Square of 52
This is what Gann referred to as his Master Calculator. It expands out 52 weeks from a predetermined start date and the price levels are formed off numbers that result in natural squares. Applied correctly, it is one of the most efficient ways to trade on a daily or weekly basis. The angles represent the natural flow of momentum and direction of a chart. This is as close to knowing the future as you can get. And for those you sci-fi junkies, you get to see a finite number of alternative conditions that may form. Right now, this is the most probable.
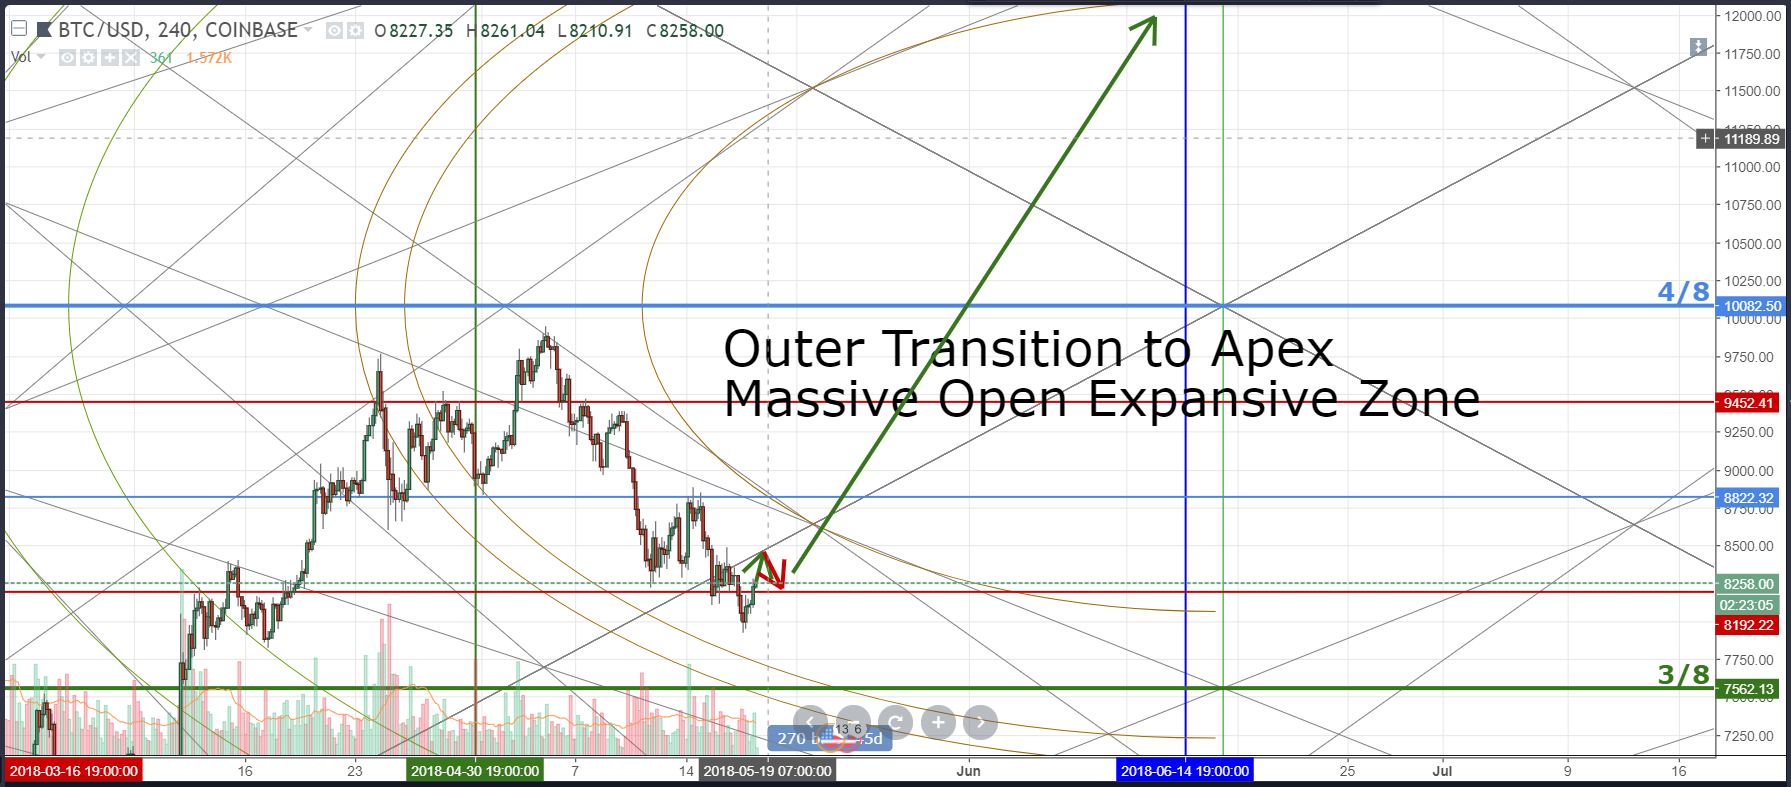
If price initally bounces off the angle above it, we should expect some pull back to the 8192.22 zone. If it does (or doesn’t), the zone in front of us is approaching what is known as the apex. We are approaching the exact center of time and price, we are returning to equilibrium and into a transition zone. But that’s not what is so exciting.
It’s the behavior of price after it crosses the inner arc.
It moves.
Fast.
And the expansion is extensive. The zone we are traveling to (if we get above the inner arc) becomes the most expansive and strongest trend we will experience until later in the year. It can not be understated the power of the moves that are coming if price enters above the arc. That $10,000 value area? It’s nothing. When price approaches that area, more than likely we just cruise right by it. Maybe cruise isn’t the word. We shoot through it.
These kinds of moves only happen once in a Square of 52. This is like a wormhole in Star Trek. When price enters it get’s whipsawed across and beyond the center. From the point of entry of the inner arc, price will move opposite/180-degrees from that location.
Which is the $11,600 area.
It looks like BTC is near the bottom of its current trend and we should soon see a reversal. It could still touch 7700 before it goes up and i think that we shall reach 9500 and then see a correction again. for now we will stay in the range of 7500 to 10000. thats my analysis and i am not a pro i am just a hobby trader mainly interested in making my trades auto using a bot i am building. so not a technical advice.
Hi, thank you for contributing to Steemit!
I upvoted and followed you; follow back and we can help each other succeed 🙂
P.S.: My Recent Post