Technical Analysis of Bitcoin and Major Alt-coins
Hello everybody,
This is my first post here on Steemit regarding crypto market technical analysis. In this post I discuss TA and an overview of crypto market which mainly is about #bitcoins price action and a little bit of TA on some major alt-coins.
So get comfortable and let’s start with some topics being discussed on YouTube. If you go to YouTube and watch some podcasts and TA videos you hear that most of them are talking about good news and saying there isn’t any fundamental reason for bitcoin price to go down and everything is perfect. These are people who may be hodling btc or maybe they really don’t know what they are talking about. TA is based on price movements and when you use technical analysis you can guess what the news would be when it comes out (you can even avoid manipulations). Always when something is about to happen you can see its effects on price beforehand, because either the news leaks out or big institutes who have professional analysts predict it and enter the market. TA and fundamentals are both sides of the same coin but you get confused when you want to use them both simultaneously. For small traders the best method is to avoid news and just trade based on charting. You will also see how easy it is to understand the market sentiment only by considering support and resistance line, some patterns and checking related charts without any complicated indicator. Then when a trend starts we will add some simple tools to find entries and targets. The most important part is to understand the price movements.
Here in the following you see why the bitcoin is in a bear territory and the alt-coins have been showing bear signals which now their bad news are coming out one by one such as #ethereum and #bitcoin cash technical issues or #EOS governance problem which may result in a hard fork. So let’s go to #bitcoin’s macro overview first.
Bitcoin:
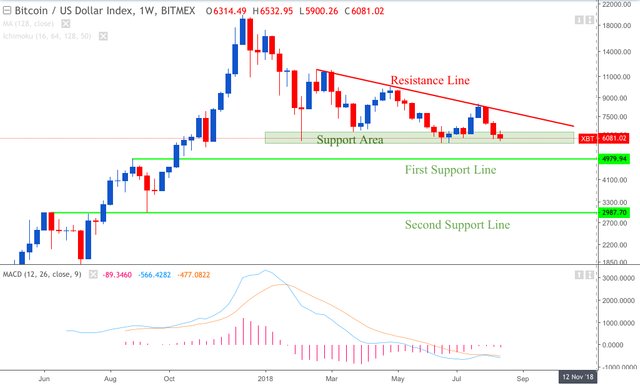
Weekly chart of #bitcoin shows that the price is in a strong support zone that every time it has came down there a strong support pushed the price up but as you can see each time after rising, #BTC made a lower high and during last 5 mounts #bitcoin price has formed a #descending-triangle. So bitcoin is bearish on weekly time frame with three unsuccessful bull runs.
During last #bull run to 8400$ everybody said that this is a triple bottom and we are going to moon because the #ETF is definitely going to be approved as well as comparing bitcoin chart to #NAZDAQ price cycle and so on. I traded the inverted H&S and made a good profit but then around 8200$ I got out (my tweet at that time)
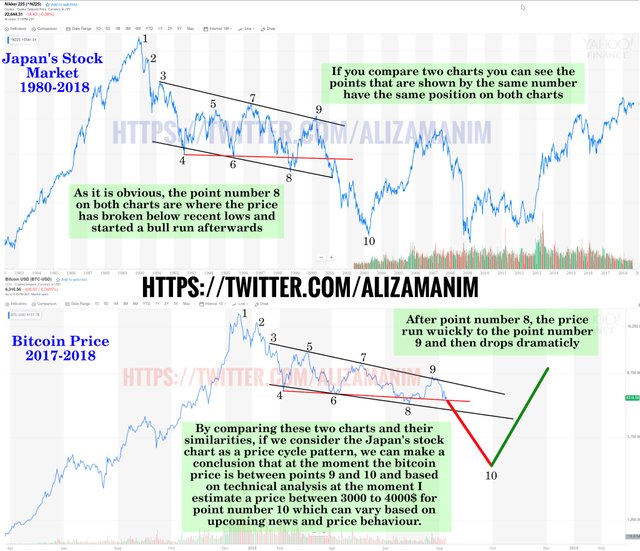
However, based on some resources I use, since bitcoin broke the 7k in Jun, I got #bearish on bitcoin and still I believe we have further down trend and lower lows to meet. Also take a look at this photo I created to compare bitcoin chart to #Japan’s #stock #market (although I believe you should only compare bitcoins price behavior with its earlier ones like 2014 but its may give you some ideas):
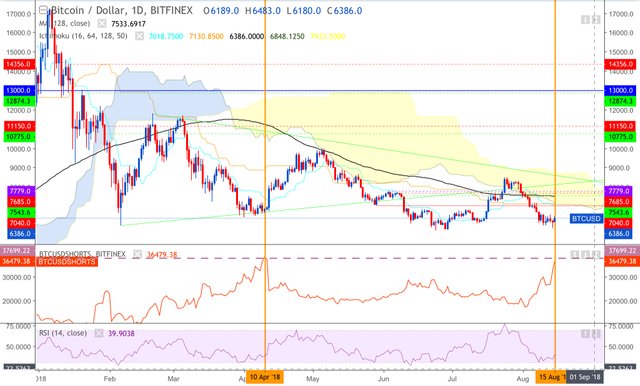
Also #bitcoin’s daily chart along with #short and #long positions on #Bitfinex imply that with a high probability we will have a bull run to some where around 7k and then maybe after some consolidation we will see more movements to downside.
So bitcoin is bullish in daily time frame.
You can see that short positions have increased insanely while the longs are dropping. You may say so this is bearish why should price goes up? When everybody is short then who is going to sell and push the price lower? In this situation people and institutes with big money come in and go long which will liquidate all these short positions that will give momentum to this bull run that is called #short #squeeze.
Long story short, I expect an upward movement before the price drop lower.
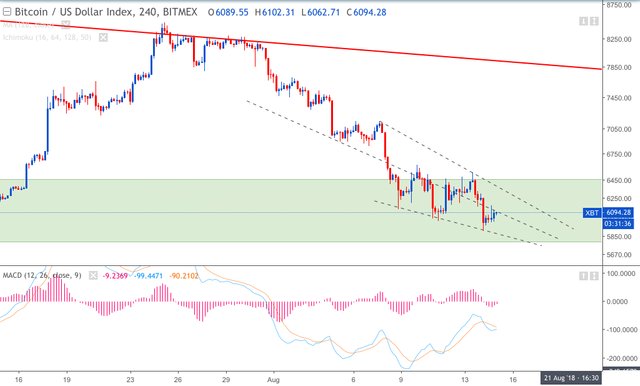
Bitcoin’s hourly chart also show that the price is moving in a #falling #wedge which is a bullish pattern but in my opinion at the moment the price of bitcoin is in “NO TRADE” zone so just be patient and wait until the time is right.
Alt-coins:
We should also consider the alt-coins situation that almost all of them except some coins like #Stellar are bleeding so bad and causing #panic #sell which is dragging bitcoin down as well. These are people who wanted to get rich over night so bought alt-coins at high prices and now are selling low (known as dumb money in the market). Here I just review some of major coins with high market cap and trading volume.
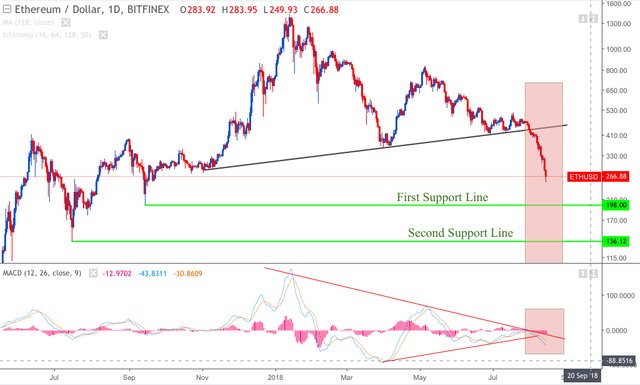
Ethereum daily chart shows that the price is fallen below the support line that was very strong and you can see the price have been bounced off of it three times. At the moment ethereum is very weak which I think is related to recent technical issues.
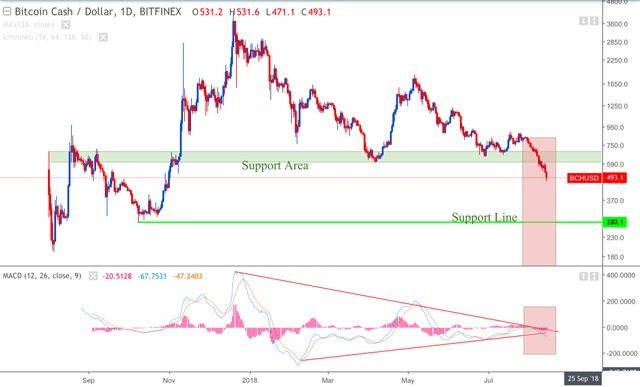
Bitcoin cash also broke through support area and is diving down. You may have heard BCH had also some technical issues and major bugs in its code and also with lightning network growing so fast its use case is under question.
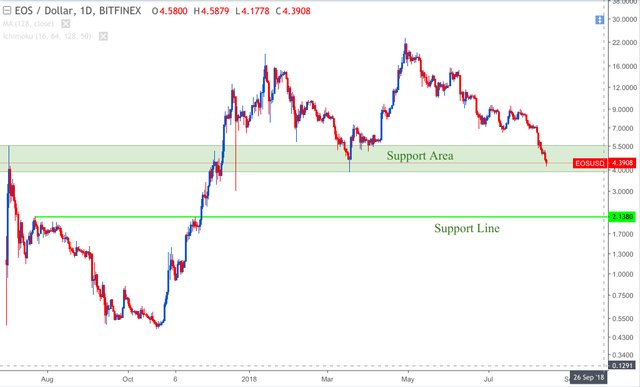
EOS with its network that recently has launched and you know all the problems in governance and so on. EOS has hold its value against dollar really well and still is in support zone but if it breaks below this area then I think it’s going to capitulate dramatically.
The last coin I am interested in its chart is NEO that was one of the coins I shorted and you can see details in TradingView post I published exactly before it starts the down trend with three targets that 2 of them have been reached so far and we are close to last target.
My advice: don’t trade at the moment and let the price find its way and decide which way wants to go then enter the market. There will be always trading opportunities. So avoid FOMO as well as panic sell.
Good luck with your upcoming opportunities



Interesting comparison with Japan's stock market. I had thought that there will be another big dip before this bear market ends but that almost seems to be the consensus now, so perhaps it wont happen?
I think you should also follow me on twitter (only if you trade time frames lower than daily) because I give updates as soon as any change happens but here I just post overviews with details. If you take a look at my tweets you understand what I’m saying.
We will have another dip after a short term bull run. I have explained that after a short squeeze that may take the price around 7500$ then we will have bear trend and the price makes new lows. Lower low depends on price behaviour befor dropping. For now around 5k is expected but it may change and even go to aroun 3k or lower. I will update every time that the market gives new piece of data. Bitcoin started the up move and the short positions are dropping already.
Congratulations @alizamanim! You have completed the following achievement on Steemit and have been rewarded with new badge(s) :
Click on the badge to view your Board of Honor.
If you no longer want to receive notifications, reply to this comment with the word
STOPDo not miss the last post from @steemitboard:
SteemitBoard and the Veterans on Steemit - The First Community Badge.