Three Tips for When to Buy Bitcoin

How can you read the market and understand when to buy Bitcoin (or any other cryptocurrency for that matter)? I want to start off by letting you know I'm no market whispering whiz kid. You shouldn't blindly follow what I do, and nor should you blindly follow anyone else.
What you should do is invest in yourself and learn the technical signs, as well as the fundamentals to buy and sell cryptocurrencies for yourself. You need to know how to mitigate your risk and have a much better reward potential for your investment or trading. The charts you'll see in this post are from Trading View and are very similar in basic design as those you can find on ant reliable exchange like Binance or Cryptopia.
When to Buy Bitcoin?
So today I'm going to be doing what I know is best for you and sharing with you how you can use these three tips so you know when to buy Bitcoin. I would like to state clearly that I'm not offering financial advice, and nor am I licensed to do so. This content is for education and entertainment purposes only. All I want to do is to share with you how I read charts to try and help you understand them a little better.
Let's have a look at three tips to spot winners in the market and get a good return on your trading investment.
Consecutive winners on a pullback
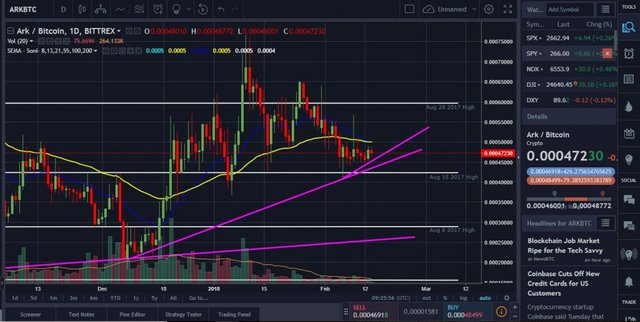
Let's take a look at Ark as our first example. Ark's price action shown here that Ark has had a very nice run up over its more longer trend. The chart shows that there have been a lot of up trends that have returned very nice, and it has a nice pull back each time. But even with those pullbacks, it continues to hold a decent amount of its and have decent gains and rally to new highs. We've seen it consecutively ever since it launched its ICO. And because of that, it's continued to rally to new highs. We even saw a rally up to 120 thousand Satoshis.
Now, this from a long-term perspective looks fantastic, from a swing trade perspective it's also great because what we are seeing is not just a nice return to uptrends, but we're seeing Ark again hold a lot of its gains, and its starting to find a slowing support around 60 thousand Satoshis.
We're seeing it now at a pullback for Ark. It's had a great uptrend, however, we've seen it in the past where even though it's had this pullback from the all-time high of 120 thousand Satoshis to 42 thousand Satoshis some panic and think that it's probably going to go to zero. But no, it won't. This is actually very healthy. We want to see pullbacks, but we also want to see the holding of price strength confirmations.

We can see that each time it has had an uptrend it held a decent amount of its gains; not all of it, but it usually comes back to correct those losses from that pullback. It's a healthy correction. You need winners, even as much as they might be the king of crypto, they might be the best cryptocurrency in your portfolio, your favorite long-term holding, and you might think they are worth much more than they actually are.
You still have to consider the fact that cryptocurrencies have pullbacks, and if they can have pullbacks; that's healthy, that's good, that means that you're most likely going to go to new highs in the future; much like Ark has in the past. Right now Ark is a good buying opportunity in my opinion. It has touched and returned from the levels that I took out a stronger position at, and is now finding stability. Generally speaking, even though it has climbed back up from the lows of 20 thousand Satoshis, this is the kind of range you might want to but in, you want to see something that has been winning consecutively and is on a nice pullback close to around 50%, which brings us to our next point.
50% Pullbacks
Now, this is getting away from the long-term perspective, this is more of a short-term perspective. Even though its good to have past history of consecutive 50% pullbacks, a 50% pullback itself, and holding the 50% pullback is a fantastic sign to buy into something.
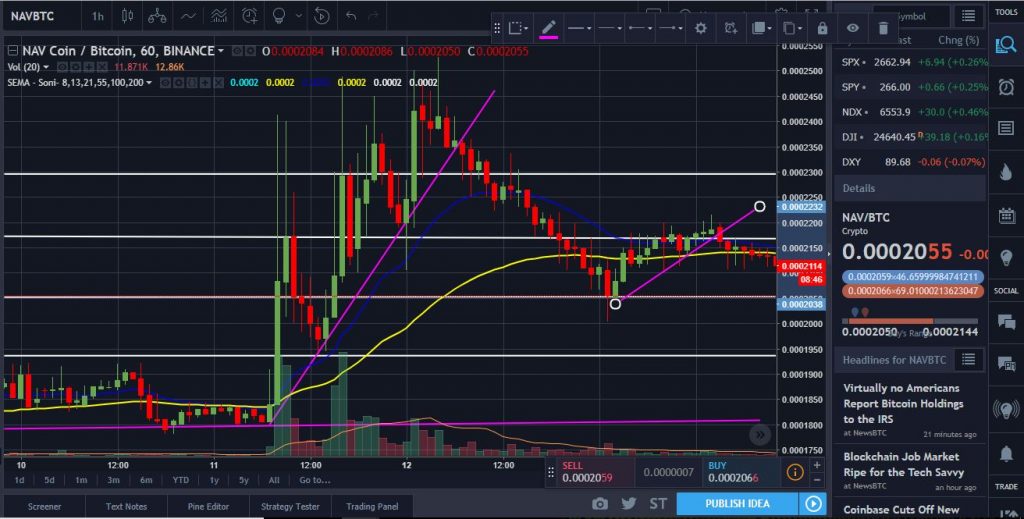
For example, we saw NavCoin take a massive run-up over the past few days, a few weeks ago. However, we've had a nice steady pullback and not a pump and dump, it didn't go up and then crash back down to its previous low in an instant, or even lower. It held a lot of its gains.
It's common for a correction like this to happen. I always caution people not to buy something once it has gone up by 300% to 400% because generally speaking it is due for a correction. What you want to look for is the pullback to not drop instantly, but to have a nice stead correction backward as NavCoin had especially compared to how fast it had the run-up. You want to look for signs of slowly pulling back and finding common support around a 50% pullback.

If we take a look at this, the major level of resistance for this was around the 40 thousand Satoshi range, well now, it's around 20 thousand Satoshis. That's a perfectly clean pullback of 50% in price action. So, when you can find 50% correction in price action, make sure that you can see those common levels of support where many times it is tested, 20 thousand Satoshis in this case. And once it has held that level multiple times, you can see that as a form of price strength confirmation to buy into that cryptocurrency.
It's not an absolute sign to confirm it is the right time for buying in, sometimes it can continue to go down as we have seen before with many other cryptocurrencies out there. However, it's a great sign, and it's a good positive confirmation that you are getting close to the right time for when to buy Bitcoin or other cryptocurrencies. This is a good confirmation that the price is most likely set to go back to new highs.
21-Day and 55-Day Moving Averages
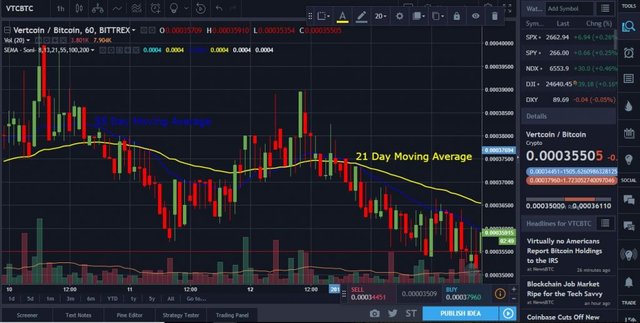
The last one I want to have a look at is VertCoin, and on this VertCoin example, I want to look at two indicators being the 21-day and 55-day moving averages. Specifically, we will look at how we get these setup. The screenshots below will help you with how to set these up. Choose colors that are easy for you to see.
There is a good reason for using these, and I'm going to outline how I use them as a bullish indicator. The 21 and 55 days are signs of momentum or signs of bullish price action so long as the price action is holding above those levels. For example; the 55-day moving average shown below. If we have a look at this in relation to VertCoin's performance when it spiked up, we can see that it maintained support really quite well on the 55-day after the uptake.
From there we can see price strength confirmation in that it had found support in the 55-day moving average. Once it broke past that and had its next uptake, it had a pullback that came to the 21-day moving average and not the 55-day moving average. This presented to be a very bullish indicator.

Moving averages may seem like simple tools that everyone is using, but really aren't being used as much as they should be. These are very effective indicators in early markets, such as cryptocurrencies. The simple indicators can help you gain an advantage.
If you can see some consistent support on the 55-day, and then again consistent support on the 21-day moving average that is a market momentum mover. That is something that is seeing confidence and exuberance, and that is when you want to buy in on a pullback. This example shows that VertCoin is holding on to the 21-day moving average and is a sign that it is trending to the upside. I always recommend that you use moving averages to identify when to buy Bitcoin or other cryptocurrencies.
This was originally posted on my blog at TechMagy and shared here to add value to the Steemit Community.
Fore more articles in the cryptocurrency space, check out the following:
- Lessons from the Blockchain: What is Ethereum?
- Where are my Bitcoins? How to Rebroadcast a Transaction
- The Enigma Crypto Protocol; Bigger Than Blockchain
- How to Transact Safely with Bitcoins
- Land Backed Crypto Seeks to Build on Blockchain Based Land Registrys
- Deeper Dive Into Hot Cryptocurrency Wallets
- Is Crypto Risking Manipulation? Goldman Sachs Offering Bitcoin
- How Does Bitcoin Work?
- What is a Custodial Cryptocurrency Wallet?
- Is storing your private key on a physical Bitcoin the best Bitcoin wallet protection?
- Hot or Cold; What is the Best Bitcoin Wallet?
- Is It Possible To Hack Bitcoin?
- Which are the best Cryptocurrency Exchanges?
- Should I Buy Bitcoin - How to Guide for Fiat to Crypto On Ramps?
- What is a Cryptocoin Exchange?
- Investing In Bitcoin – Why You Should Have Multiple On Ramps
- Starting with Bitcoin - Encrypted Email and 2FA
- Will Bitcoin Replace FIAT Currency?
Coins mentioned in post: