ADSactly Crypto Roundup
Regulators in China, the USA, and Canada have all either released statements or have taken actions regarding I.C.O. and whether or not they are securities, whether or not they can be used as vehicles for fund raising fraud. The answer, a resounding yes. Yes I.C.O. are securities and distributors must be licensed. Yes I.C.O. is a vehicle that can be used for fund raising fraud.
With this determination a broad sell off was triggered across the cryptographic asset space, seeing steep declines from small to large cap cryptos. This was a definite fear trade and those with some cajones bought the dip on select names.
The logical thing to do in this situation is to take a risk off approach to the I.C.O. space until more clarity is provided from regulators and stick to large cap stalwarts - thats not to say there isn't profits to be had in small cap alts, but for the less savy, risk is risk.
Bitcoin
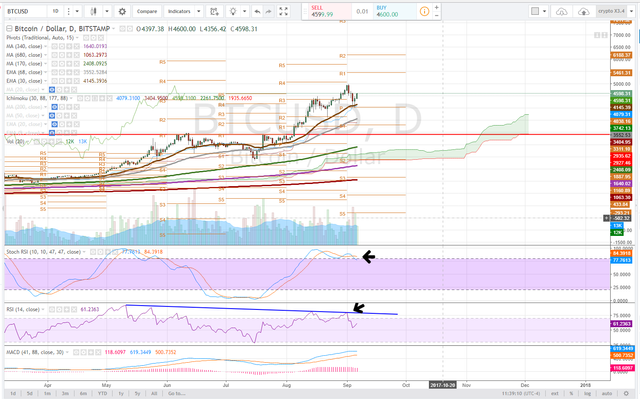
Daily Chart
On the daily time frame Bitcoin has tested and bounced off of a pivot point maintaining the 30ema support, this was a strong move. Caution is warranted when viewing the downtrending RSI and top heavy stochastic RSI (Velocity)
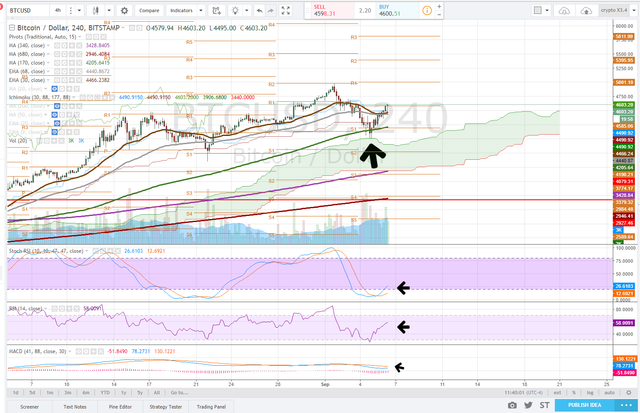
4 Hour Chart
On the 4 hour time frame we see that BTC had dropped down to the Ichimoku support (adjusted for 24 hour trading). Bouncing off of this area led to a recapturing of the 170dma and pivot support 1. Currently BTC is testing the 4-hour pivot and with some more outsized volume to drive the MACD into a bull cross the uptrend can continue. First milestone is to hold this pivot range and then retest the previous high. Consolidation should and could occur here at the pivot the true test is if the range holds.
Trade: Enter half position here, add on a dip to 30ema set stop loss just below
Alternative: Wait for consolidation and possible dip or breakout confirmation of a run, scalp the run.
Ethereum
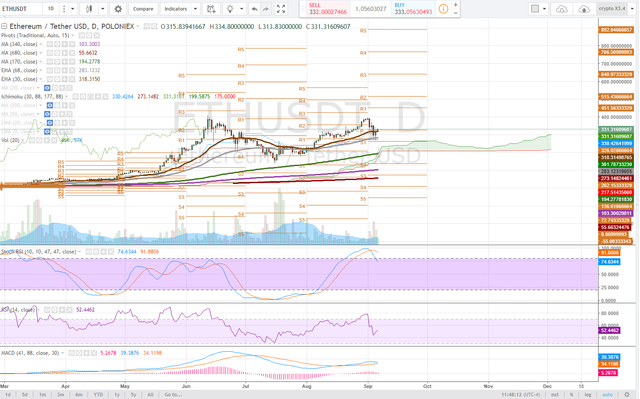
Daily Chart
After the steep run up to $400 the daily RSI on ETHUSD became very overbought and a pullback was necessary. News out of china that rattled the entire market exacerbated the pullback and brought the price back down into the $280 range where the 68ema was bought up and now ETH is working on the daily pivot. This move brought the RSI back into the midground and makes for an interesting looking stochastic RSI. Watching for buyers to continue to come in and volume to keep the stochastic RSI in uptrend and the MACD in bullish divergence.
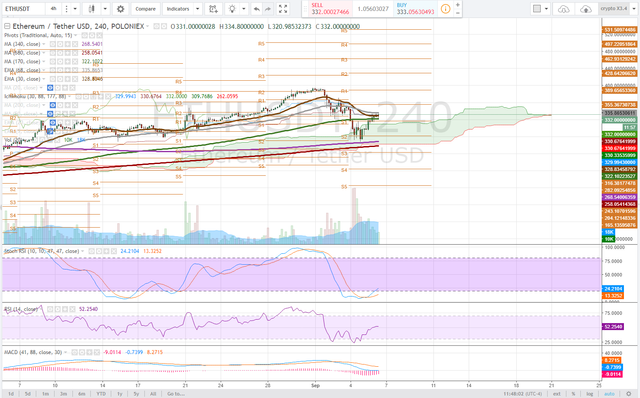
4 Hour Chart
On the 4 hour chart you will note the RSI that has created a double bottom in oversold and led to this bounce back above pivot support 1. Not the stochastic RSI here is in down trend but the MACD is curling upward and is in a flat range hugging deviation zero. Price progression will occur as the price consolidates here to push through the 30ema and 68 ema. ETH must hold S1, $316 range.
Trade: Scale half here add on S1 or breakout. Set stoploss just under Ichimoku support $309
Alternative: Buy the breakout or take a short position on breakdown.
LiteCoin
Daily Chart
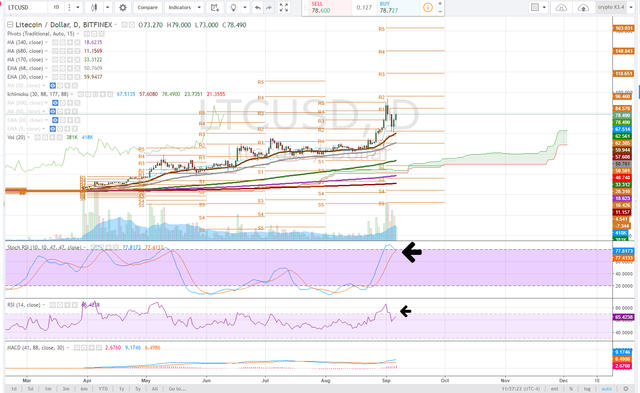
LTCUSD recently broke out of a wedge formation as we at ADSactly called for it too setting new all time highs and subsequently pulled back with the rest of the market to test the daily pivot. Caution is warranted here as the stochastic RSI is curling and the RSI is potentially forming a Head and Shoulders (yes the patterns apply to certian indicators).
4 Hour Chart
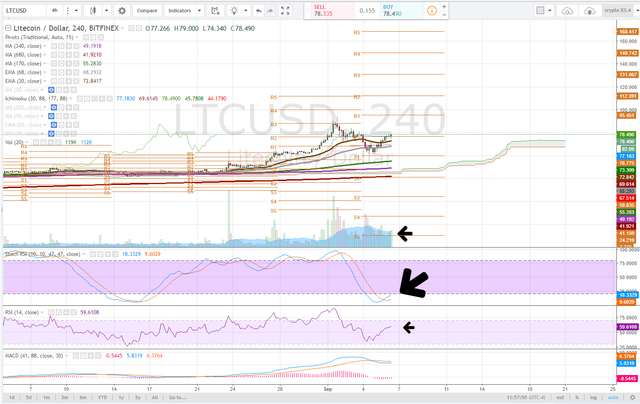
On the 4 hour time frame we are going to me looking for some price consolidation here at the pivot and a possible retest of previous highs. The stochastic RSI could resume uptrend if the buyers come in and take the velocity up a notch leading to a bullish MACD cross.
Trade: Enter here set stop loss just below pivot (76.75) or 30ema, (72.82) depending on risk tolerance.
Alternative: None
XMR
Daily Chart
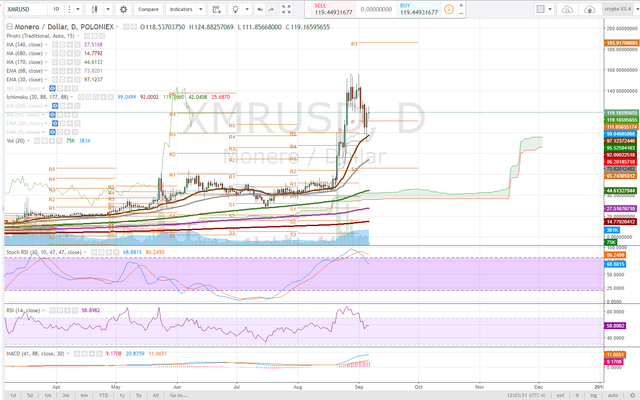
XMR recently had a big run up and around the top we at ADSactly made note that only a lunatic would be buying. This steep decline was almost 40% from the top and began before regulator news and was accelerated by the broader market sell off. Dip buyers came in but today we are seeing selling pressure peg the price just above the daily pivot. XMR must hold the daily pivot. Note the stochastic RSI has slipped from uptrend as we observe volume consolidation, this is actually to some degree bullish consolidation when we observe the volume. However, XMR was up 440% from the previous lows.
4 Hour Chart
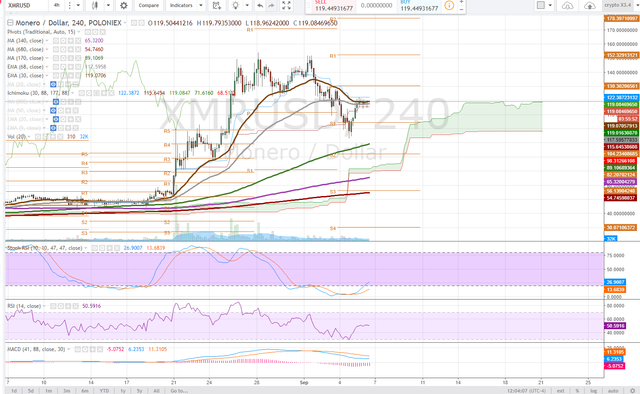
The 4 hour chart is showing bullflag consolidation, a cautiously bullish stance here is reasonable. Note the Stochastic RSI curling up and will pull the MACD with it. The buyers have to come in in a big way to drive the bull flag breakout here.
Trade: By on break of previous high in 4 hour consolidation, above $122.
Alternative: By daily pivot support $110 and set sell stop 1-2% below
BitCoin Cash
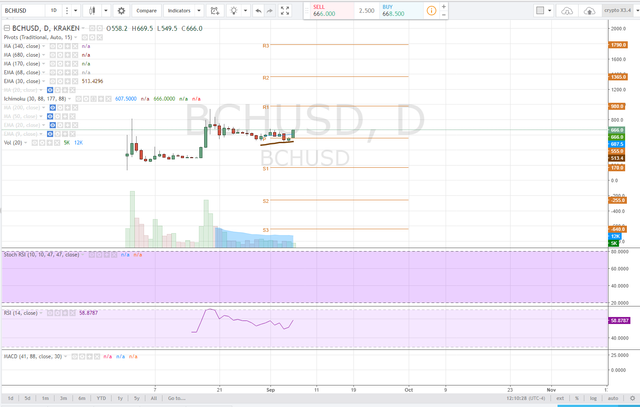
Daily Chart
As time passes the bitcoin cash chart is starting to develop as we see it bounce off of the 30ema and the RSI is heading towards over bought. This is a sizable move and I don't suspect it is over. First Target is previous high $780 and then we look to the $980 range, R1
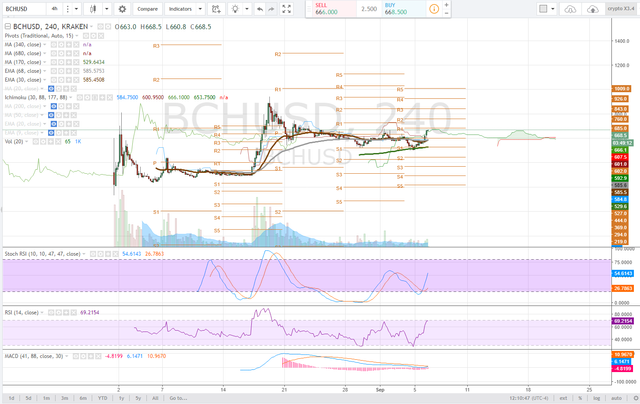
4 Hour Chart
On the 4 hour chart a clear pattern of higher lows and higher highs is apparent. This bounce of the 170 DMA and S1 support is very condusive to price progression. Notice the MACD is about to have a bull cross with the Stochastic RSI pushing towards uptrend. Buy consolidation dips and watch for volume to drive a true break higher
Trade: Buy half position and scale on price consolidation, likely to see a bull flag forming in the shorter term time frames. Add on breakout or dip lower to previous high $633. Set sell stop 1-2% lower depending on risk tolerance or join me for a ride.
Alternative: Wait for true price consolidation on the 4 hour time frame or a breakout.
Risk Trade: Hop In
Bitcoin cash during normal market conditions behaves like a hedge against bitcoin. Recent Market turmoil was the result of news from regulators and is what we know as a "black swan" event. It was an opportunity to shop for some discount names in the crypto market, add to positions and make some $ long or short.

There may be a delay between the time this article was written and the time it is posted.



Amazing how the news affect the markets, and it looks like China Gov. might chill with the regulations
I think that the regulations were pretty chill to begin with, the halt was just to clear the slate and implement requirements. Very amazing how news can impact markets! Thanks for commenting!
Yo ,
Thanks for the great content
quite welcome :) we want to help people navigate the very often disorienting price action of cryptos!
You might have the better analysis of what happened in the aspects of technic and knowledge.
However, I might have figured out the real reason for the recent drop:
How Paris Hilton nearly destroyed the cryptocurrency market!
P.S.: My post might not be a 100% serious! If you consider it as pointless spam, just tell me, I will remove it if you wish!
yaaaaa if you got nothing to add man?
Just wanted to bring a little bit fun to this post ;)
I can not compete with the technical aspects of your analysis!
all good!
Good stuff @satchmo. I think you should have included BitShares as well!!!
hahaha -- for these I am trying to stick with the safer stalwarts but you can catch me around discord or steemit chat if you have questions or would like me to take a look at something :)
This is a good thing to the crypto world, creates a safe environment for the chinese people to invest and dont get scam by fake ICO's and we can buy cheap coins.
Thanks for the info
Absolutely, the silver lining is a purge of the shysters! Will be hiccups along the way but I personally see this as very positive.
ISO is an effective means of attracting investments in new technological projects and start-ups. This explains the high popularity not only among the infestors, but also among the scammers. You made very useful graphics. Your posts help me navigate in a new area for me. Thank you very much for your work!
Thanks, glad it helps, if you have questions feel free to ask!
Very informative post .. great work keeep it up... upvoted!!!
Thanks, hope it helps people get an idea of whats going on out there.
Well! I was about to go check some charts and prices on my lunch break but you already summarized most of what I was looking for quite nicely!
I've been watching pretty closely as I bought that dip Saturday and Sunday..added ethereum, bitcoin, and STEEM (of course!). Looks like they're all up from my buy point. I don't make big buys thought so I shouldn't worry so much but I still do check the prices pretty frequently.
Nice analysis! I likes.
Thanks, I hope to be able to shed some light on whats going on with the cryptos week to week, was just away for a bit, but back now hahaha! Glad you liked it, stay tuned for more!
hi bro, very nice knowledge you share, i really need it.
Give us a follow, we will be trying to help people in navigating this new paradigm of trading cryptographic assets!
@adsactly that is some very useful information you have put together. I really appreciate this information. I.C.O are both an opportunity as well as a risk. Do you think an analysis can be applied to project the listing price of an ICO?
Plus how much data in terms of days is required for a coin to have sufficient data for doing a chart analysis of the coin that in your opinion would be reliable.
at least 24 hours to get any kind of reliable information from intraday indicators. BCash took 2-3 weeks to show us anything on the 4 hour time frame when it finally popped off.
So yes you can apply to ICO's once they are released but just like an IPO it is rare you will see technical traders buying, they usually wait. The other alternative is a method called tape reading, in the case of crypto, reading the order book, what are the buys and sells doing.