The fractal relationship between bitcoin’s first two bubbles and what they might tell us about a third
I wanted to share this absolutely excellent, and prophetic article written by Paul Gordon, founder of Coinscrum, all the way back in January.
I have been aware of this chart for a few months now, and it seemed wildly optimistic the time I first saw it, but as we are now within touching distance of $6000, and we seem destined to reach the Wave 3 high of $9300, the final Wave 5 high of $33,717 does not seem so impossible any more.
In fact, everything on this timeline seems to be happening much faster than expected.
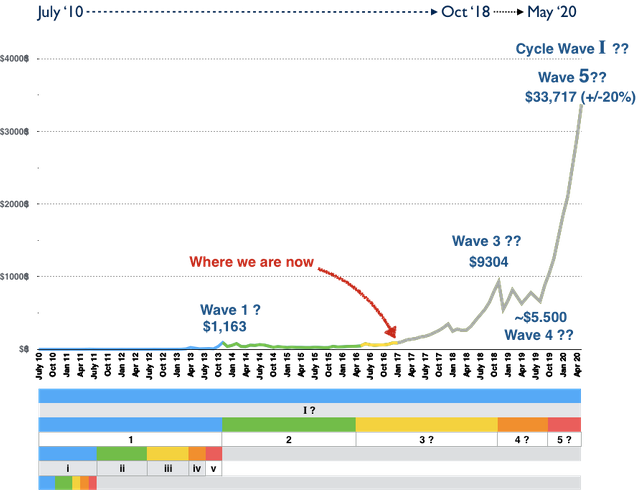
Chart people's reasoning of future prices can be entertaining.
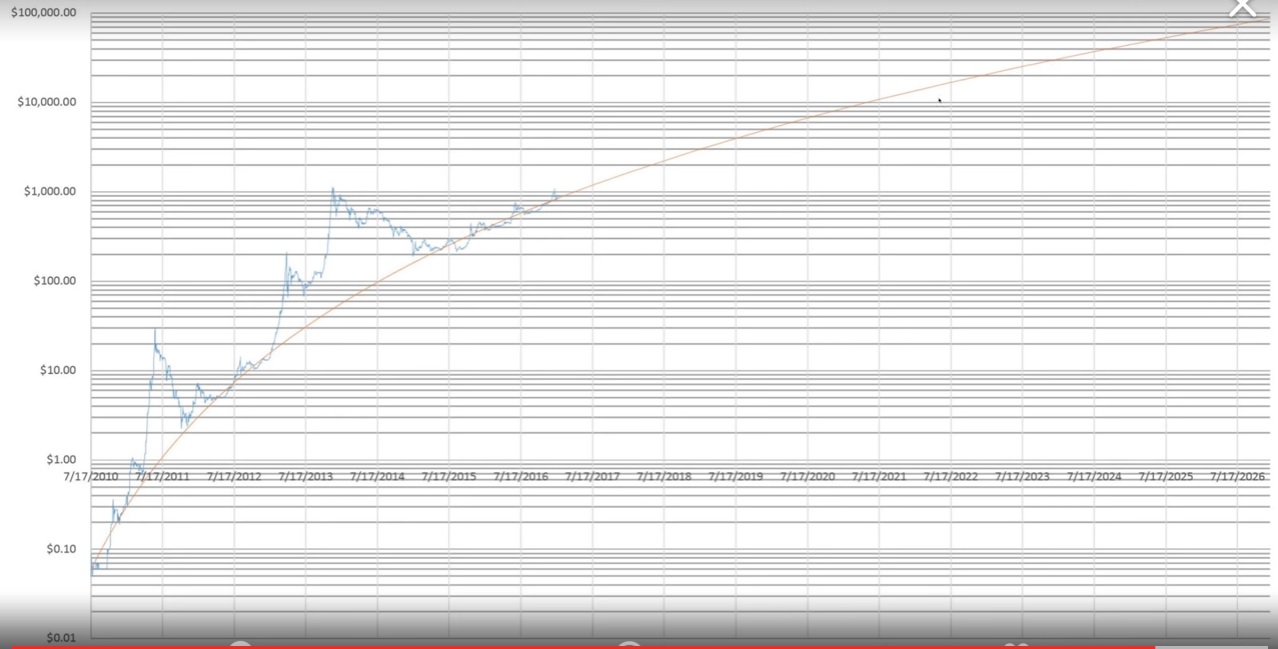
I am also cautious of following charts, but this person is a more serious technical analyst than most. I'm mainly drawing attention to the article because of how it fits together with Bitcoin's long term growth curve as shown in the chart below. If we are heading into another bubble 1000% above the trend line, the peak would put us around $30k...
Here I have extrapolated the trendline to 1 million. But maybe it is a little bit too flat because 2042 will be a little bit late for the 1 million dollar.
Every new follower gets an 0.10$ upvote on his latest post. But please make sure that you are interested in my content.
I honestly think we'll hit 1 million much sooner than 2042. I think we will see that number at the peak of one of the next bubbles, sometime in the 2020s, but as a stable fair value, probably will take a while longer.
I found this months ago:
Every new follower gets an 0.10$ upvote on his latest post. But please make sure that you are interested in my content.
The wave patterns in the article would fit perfectly onto that chart, taking us into a new bubble with a peak around $30k, which is 1000% above the trendline. I think it's good to get this chart out there, so that people know how undervalued Bitcoin really is right now!
According the black chart bitcoin is fairly valued and according to my chart its a little bit overvalued. This is the way I see it. But 30000$ was also my own forecast for the next bubble.
That curve fits quite good and i like the pattern because i'm a human! 😁 Thank you!