The Game of Charts: Bitcoin Update- 20 Aug, 2018
"The chart speaks louder than words"
Daily bitcoin technical analysis with fewer words and more information so that you can have maximum information just with a glance without wasting any time.
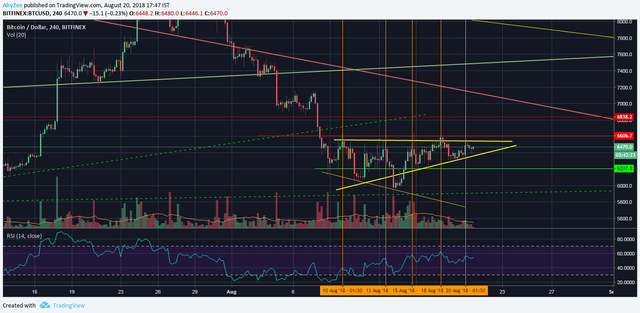
- Bitcoin has been hovering in this range for past ten days
- Looks like an ascending triangle is forming
- The vertical orange lines showing that only the RSI has increased in the past 10 days but in comparison to that Bitcoin price hasn't increased much
- Every time BTC tried to move upward, it has found strong resistance at $6600 level
- The lower yellow trend line has acted as a support several times. What if this support is broken?
- If the current price action of the bitcoin is only an RSI cool off, so that Bitcoin can further move downwards, then we may see bitcoin in $5600 - $5400 range.
- A violent move is coming. Make your strategy and be prepared to catch the move

Disclaimer:
This is purely a technical analysis and it is to be used for educational, entertainment purposes only. This is not a financial advise to buy or sell Bitcoin and I am not a financial advisor. Do your own research before investing.

Please Upvote and Resteem

I appreciate your support
Follow me @ABYZEE

![]()
good post !!
It'll be a big help to you.

byteball airdrop
https://steem-byteball.org/#QLOPGPP4MYKOJRY5ZEDBO4TN5J5WHSJO
Thank you. Keep supporting :)
Nice technical analysis
Thanks for the info
Keep it up 👍
Thanks dude
@resteemator is a new bot casting votes for its followers. Follow @resteemator and vote this comment to increase your chance to be voted in the future!