Part 1: Creating the Steem Tag Explorer in Tableau Public--The Table Lens
.png)
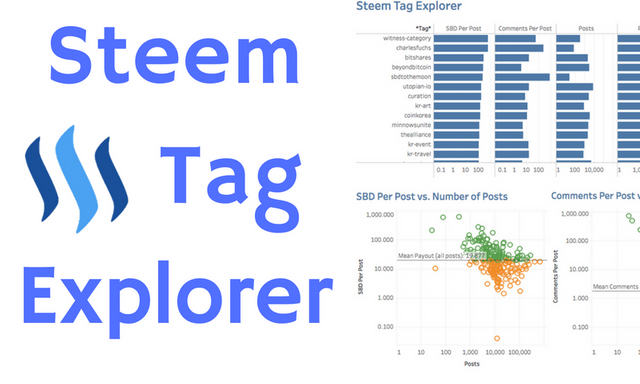
In an earlier post I described a web-based interactive Steem Tag Explorer that I created in Tableau Public. In this post, I will show you how to connect Tableau Public to an HTML table on the web and recreate the Table Lens, which is the top graph on the main dashboard (shown below). I will cover the other graphs in followup up posts.
Before starting, if you have not done so already read my earlier post: New Interactive Steem Tag Explorer Now Available
And try out the live version: Steem Tag Explorer
If you plan to follow along you will need:
- Google Drive account
- Tableau Public (which is free) or a paid version of Tableau's visualization software.
Create a Data Connection to the Trending Tags Page
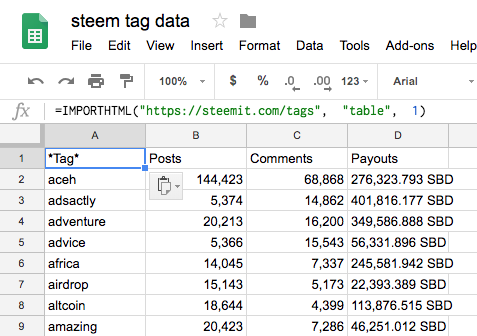
The Steem Tag Explorer depends on having access to the dynamically updated data on the Steemit Tags Page, which is just an HTML Table with columns for Tag, Posts, Comments, and Payouts. The easiest way to bring this data into Tableau Public is through a Google Sheet. To do this, create a new Google Sheet, give it a name (I've called mine "steem tag data") and in the top left cell enter:
=IMPORTHTML("https://steemit.com/tags", "table", 1)
This tells Google Sheets to load the first HTML table on the web page. You should then see the data load into your spreadsheet:
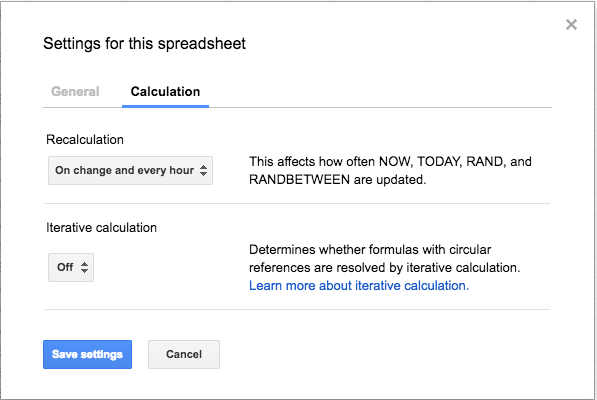
By default, Google Sheet will not dynamically update this data. To change this go to File->Spreadsheet settings... Click on Calculation and then change Recalculation to "On change and every hour":
Next, create a new worksheet in Tableau. On the Connect screen select More... Google Sheets:
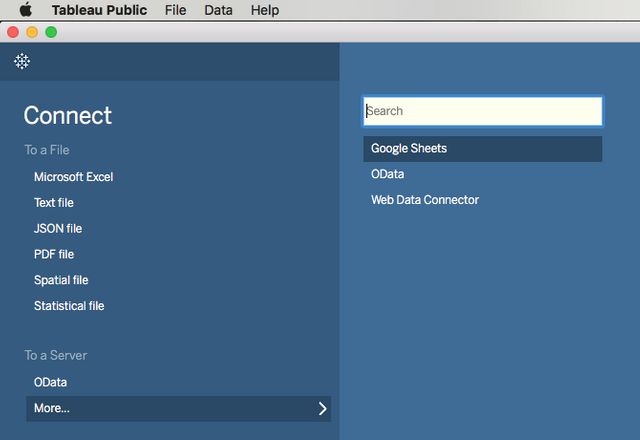
Tableau will then switch to your browser and ask you to log in to your Google account. Once you log in and grant Tableau permission to access your account you will see a list of your Google Drive files.
Select the Sheet that you created above.
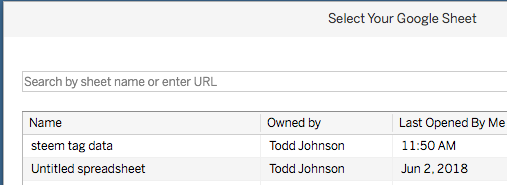
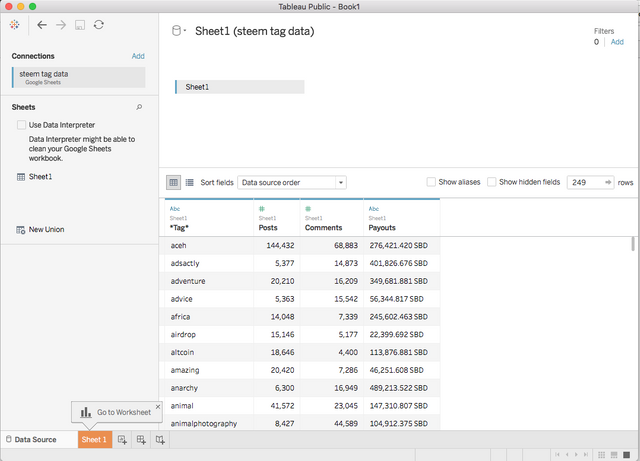
Select the sheet you created above and tell Tableau to connect to it. Tableau will show you the Data Source screen, with the first few rows of the data file:
As a note: one time when I did this, Tableau kept bringing in an empty data sheet. I quit Tableau Public several times and restarted it, each time connecting to the same sheet until it finally pulled data in.
Prepare Data Fields in Tableau
Click on the orange Sheet 1 tab shown above to go to the Sheet 1 Worksheet:
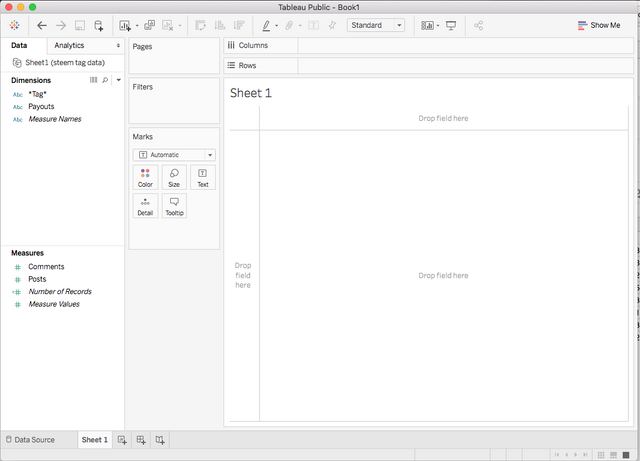
Here you can see that Tableau has separated your data fields into Dimensions and Measures. By default string fields are read as Dimensions and Numerical fields as Measures. One problem is that Payouts is listed as a Dimension. Also, the small blue Abc next to it, indicates that Tableau has read it as a string. Tableau did this because the field contains a real number followed by SBD, such as "276,421.420 SBD". We want to treat this field as a number, not a string. To do this, right click anywhere in the white space underneath dimensions or measures and select Create Calculated Field...
Change the name to "Payout" and enter the following code:
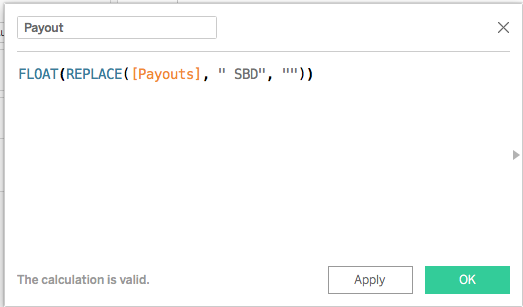
This calculation replaces " SBD" with nothing (in other words, it just truncates the last 4 characters) and then converts the truncated string into a floating number.
Select ok and you'll find your new calculated field listed under Measures:
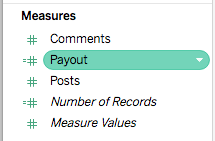
Notice the =# next Payout: that tells you that Payout is calculated field (the =) and a number (the #).
Finally, change the default number format for Payout so that it will display 3 digits after the decimal:
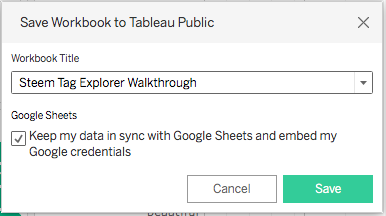
Be sure to save your workbook. If you are using Tableau Public you can only save to your Tableau Public online account. I'll call my workbook "Steem Tag Explorer Walkthrough". Also, check the option to keep your data in sync with Google Sheets:
Create the Table Lens
First, although it looks like there are three graphs on the main dashboard, there are actually 6: three with linear axes and three with logarithmic. This is due to a Tableau limitation that prevents users of published dashboards from easily switching between axis types. Instead, you have to use another Tableau trick called Sheet Swapping. I'll show you how to do that later in another post. For now, lets create the linear axis Table Lens.
Build the Basic Table
Start on Sheet 1 by dragging Tag to Rows:
Next drag Measure Names to Columns, followed by Measure Values. These fields are automatically created by Tableau. Measure Names contains the names of all of your Measures, whereas Measure Values contains their values. Dragging them to Columns results in a table with all of the measure names as column headers with their values below shown as bars, which is the default for this type of data and data layout:
You don't want the autogenerated field, Number of Records, in your visualization, so just right click its header and select Exclude:
Note that a blue "pill" called Measure Names appears under Filters. This is because the menu command you just gave is actually implemented by adding a Filter on Measure Names that removes Number of Records. You can edit that filter directly, which is what we will do below to add new fields.
Add Calculated Fields
The Table Lens also includes columns for SBD Per Post and Comments Per Post. To add these, first create new calculated fields for each with the calculations:
SBD Per Post: [Payout]/[Posts]
Comments Per Post: [Comments]/[Posts]
Edit the Measure Names field filter and check off the new fields:
Now drag the column headers to reorder them:
Now is also a good time to rename the tab from Sheet 1 to "Table Lens (Linear)". Just double click the tab and edit the name.
Remove Axis Titles
Double click any of the Value axis titles and Delete "Value", since the titles are redundant and provide no real value to the user:
Set the Default Sort
Sort the rows in descending order by SBD Per Post:

When you save your workbook to Tableau Public, the visible state of each workbook, such as the sort order, becomes the default for web viewers of your published dashboard.
Format The Tooltip
The default tooltip is ok, but we can make it look better:
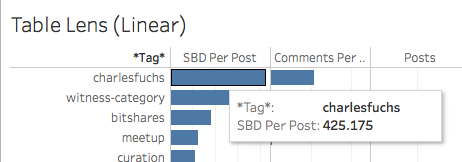
Edit the tooltip:
Create Table Lens (Logarithmic)
This is easy. Just right click the Table Lens (Linear) and select Duplicate:
Double-click the tab and change the name to Table Lens (Logarithmic):
Finally, double click the X axis and change to Logarithmic:
That's it! You now have the two Table Lens charts that form the top part of the Steem Tag Explorer.
Be sure to save your work. If you are using Tableau Public, when you save your workbook, it will bring up your browser showing your work on Tableau Public. You've also learned how to connect to data in an HTML table such that Tableau can update it automatically once each day. As a Tableau Public user you cannot set a different update schedule.
To Learn More...
For more on the theory of visualization and other how to articles such as this one, please follow me @toddrjohnson.
You might also want to check out my first post on Visualizations as Mappings. It also includes a link to an interactive Tableau Visualization.
- Create Innovative Visualizations by Understanding that Visualizations are Mappings from Data to Visual Marks and Features
- Visit the live Steem Tag Explorer
- Read about the Steem Tag Explore in this article: New Interactive Steem Tag Explorer Now Available
Todd
Congratulations! This post has been upvoted from the communal account, @minnowsupport, by toddrjohnson from the Minnow Support Project. It's a witness project run by aggroed, ausbitbank, teamsteem, theprophet0, someguy123, neoxian, followbtcnews, and netuoso. The goal is to help Steemit grow by supporting Minnows. Please find us at the Peace, Abundance, and Liberty Network (PALnet) Discord Channel. It's a completely public and open space to all members of the Steemit community who voluntarily choose to be there.
If you would like to delegate to the Minnow Support Project you can do so by clicking on the following links: 50SP, 100SP, 250SP, 500SP, 1000SP, 5000SP.
Be sure to leave at least 50SP undelegated on your account.
Congratulations! Your post has been selected as a daily Steemit truffle! It is listed on rank 10 of all contributions awarded today. You can find the TOP DAILY TRUFFLE PICKS HERE.
I upvoted your contribution because to my mind your post is at least 44 SBD worth and should receive 135 votes. It's now up to the lovely Steemit community to make this come true.
I am
TrufflePig, an Artificial Intelligence Bot that helps minnows and content curators using Machine Learning. If you are curious how I select content, you can find an explanation here!Have a nice day and sincerely yours,

TrufflePig