THE BULLISH AND BEARISH CANDLE STICKS AND WHAT THEY SIGNIFIES
Hello to everyone in this wonderful community and on the steemit platform at large today. I greet you all in good spirit and I want to believe that we all are doing just great today and if so we give God the praise for the sustenance of life and good health.
It is indeed a wonderful day and today I will be talking about the two basic candle sticks which are the bullish and bearish candlestick and also what they signifies. This topic is important especially to those who are interested in cryptocurrency trading as though it will give them more insight regarding trading and how it works.
It is expedient that new traders gets familiar with the candle sticks and what they depicts in the cryptocurrency market trading in other to understand what is happening in the cryptocurrency market and also know what kind of entry order to execute according to what the candlestick is depicting in the cryptocurrency market trading. So I urge you all to sit tight and relax as I begin the discussion for the day.
We all know that the candlesticks are a visual representation of asset price and as such it tells us the current price value regarding an asset at a particular point in time. We also talked about how candlestick depicts the volume of traders in the market.
When the candlestick is long it means the volume of traders at that particular point in time is on the high side and it also implies that many traders are interested on the portfolio. So we get to see long candle sticks as a result of high volume regarding the trade in the market.
In same way, the short candle sticks also depicts asset price value but here it shows that the volume is quite low and that is why it depicts short candlesticks as we get to see less traders trading such portfolio at a particular point in time. Today we will be talking about the bullish and bearish candlestick in the cryptocurrency market.
THE BULLISH CANDLE STICKS
In the cryptocurrency market trading , the bullish candlesticks are green in color and that signifies that the price of the said portfolio is on a high trend. It means that more buyers are in the cryptocurrency market purchasing a particular asset and when that happens we get to see green candlesticks in the cryptocurrency market chart.
Just as I have said earlier, the size or height of the candlestick depends on the amount of volume and the amount of volume is dependent on the number of traders purchasing the said asset in the cryptocurrency market.
So when we see a long candlestick it implies that many traders are interested in an asset and as well purchasing the said asset and when we notice a short green candlestick it means that the volume is low and the number of traders buying the asset at that particular point in time is less.
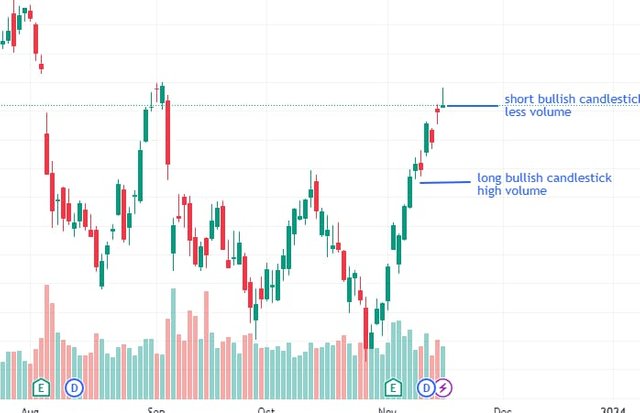
The bullish candlesticks often follows a particular pattern which is a rising trend movement. No matter how large or little the volume is, it always maintains a particular uptrend movement as asset increases in price value. A long candlestick depicts a great purchase and a high volume and a short candlestick depicts a less volume and a less purchase amount in asset.
If price continues on this trend movement for a given time, this will increase the price of the asset as more traders come into the market to also take advantage of the portfolio at that given time. Most traders such as spot traders make gains when the price of an asset is rising and this is because they must have purchased it at a lesser price compared to what is currently seen in the market.
And other traders such as futures traders often take advantage of the market by making an entry order as the trade goes up and then exit when their take profit hit.
Now that we all are familiar with the bullish candlesticks, let's talk about the bearish candlestick.
BEARISH CANDLESTICK
When the bearish candlestick is seen in the cryptocurrency market chart it means that the price of a particular asset is going down. This is a visual representation of a downtrend in asset price value. It also comes in the same form as the bullish candlesticks.
The bearish candlestick is represented in two ways, first is the long candlestick and the second is the short candlestick. The long candlestick shows that there is a great sell off of an asset and hence this affect the price of the said asset drastically. It can be considered as a high dump of the asset where we get to see a great number of traders selling off the said asset as a result of a thing or another.
This is visual confirmed as we get to see long candlesticks in the cryptocurrency market trading depicts low prices value. It also has a particular pattern of trend movement. The bearish candlestick has been designed to take a downtrend pattern of movement as it goes below the previous price value of an asset, depicting lower lows and hence the value of the asset keep deteriorating.
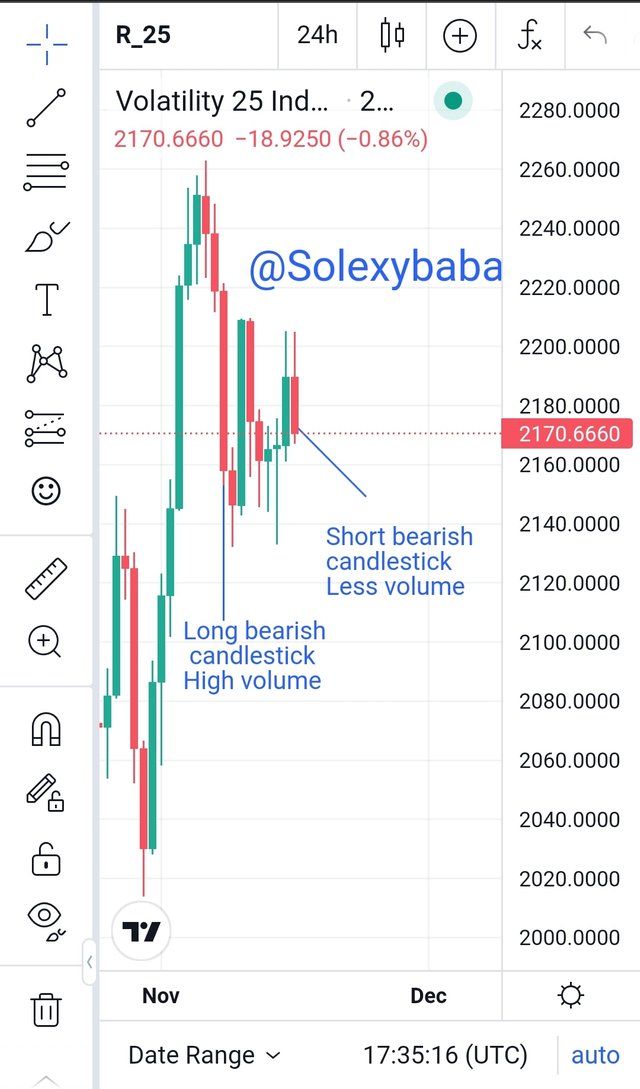
The height of the candlestick depends on the amount of volume and the amount of volume is dependent on the number of traders that are involved in the selling off of the particular asset in question.
The long bearish candlestick proves that large amounts of holders of such asset are laying off the asset in the cryptocurrency market and this affect the price of the said portfolio so well and hence it may trigger either an opportunity for both spot traders and other traders to take positions to buy or may lead to a continuous sell off of the asset depending on the situation as at that particular time.
The short bearish candlestick shows a sell off of a particular asset but in a lesser volume as such the price can take a retracement back to where it came from as lesser volume proved the motion that only fewer traders are letting off the asset in the cryptocurrency market.
CONCLUSION
Candlesticks helps us to understand the movement of cryptocurrency assets price value in the market and with the candlesticks we get informed through the visual representation of the market chart about the asset price movement. This is a tool that assist traders to see the price value of an asset and hence make their entry order according to the price movement at the said time.
With the candlesticks we get to see what is currently happening in the market pertaining a particular asset and what has already been done in other to make wise decisions before executing our trade in the cryptocurrency market. Thank you all for having me today. I look forward to seeing you all in my next teaching.
Thank you, friend!


I'm @steem.history, who is steem witness.
Thank you for witnessvoting for me.
please click it!
(Go to https://steemit.com/~witnesses and type fbslo at the bottom of the page)
The weight is reduced because of the lack of Voting Power. If you vote for me as a witness, you can get my little vote.
https://twitter.com/SIsreal2299/status/1725207498754281712?t=m6qfg7oEBZCwTrP1CqFTTw&s=19
Upvoted! Thank you for supporting witness @jswit.
Very profound teaching sir I've really learnt a lot
Hello @solexybaba
Please make use of landscape images rather than portrait images.
Thanks!