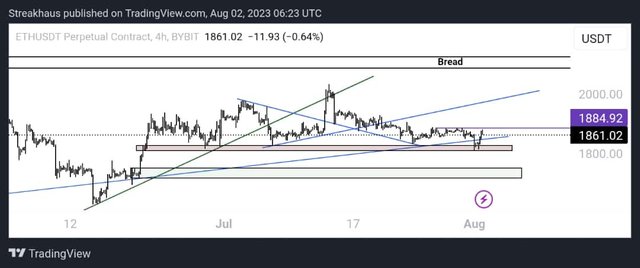
Understanding top-down analysis in the crypto market
It is yet another wonderful day to share with you all an insight into the crypto market and I'm delighted to be your host once again. Today we will be looking at an important topic titled The top-down analysis strategy.
One will want to ask, what does it mean by top-down analysis? Well, ask no more because I will explain it to your understanding today. In the crypto market, the candles we see represent time. When you check the charts for 1M, it means every candle represents 1M.

If you check the chart for 30M, it means each of the candles represents 30M, if you check the chart for 1H, it means each of the candles represents 1H, if you check the chart for 1D, it means each of the candles represents a day and so on.
I believe this sounds interesting as I got to know about this not long too. Now, top-down analysis means checking the chart from a higher timeframe down to a lower timeframe. A very good example commonly used is when a trader wants to analyze the market, he checks the weekly chart then moves over to the daily chart then to the 4H charts, and finally to the 30M chart to .same an entry.
You will notice that the trader checks the weekly chart to know the state of the market, then moves to the daily to confirm it then goes to the 4H to be certain, and finally makes his entry in the 30M. Now the secret behind this is simple, you go to this different timeframe to determine the direction of the chart and also spot major support and resistance zone.
The crypto market is analyzed based on the previous data. If a level is respected by the market more than once, it is a level that needs to be taken into consideration as the price will tend to respect the level even more. So that is what top-down analysis is all about.
It is also important to state here that the 30M is not a compulsory timeframe to enter your trade but if this time respects the same level of support and resistance with the 1H, 4H, 1D, and the weekly chart, then you must use it as your entry. You can go as low as checking the 15M and the 5M to see if the level marked in at least the 4H charts is respected.
Taking your entry from a higher time frame such as 30M helps you to stay more in the market. The top-down analysis also helps you to stay longer in the market because you already know the major support and resistance level at which the asset will be going if going bullish or bearish.
I will discuss more on this with practical examples for all to see in my next lecture. I do hope that this part is well understood. I wish you all a happy reading.
Thank you, friend!


I'm @steem.history, who is steem witness.
Thank you for witnessvoting for me.
please click it!
(Go to https://steemit.com/~witnesses and type fbslo at the bottom of the page)
The weight is reduced because of the lack of Voting Power. If you vote for me as a witness, you can get my little vote.
Upvoted! Thank you for supporting witness @jswit.
Congratulations, your post has been upvoted by @scilwa, which is a curating account for @R2cornell's Discord Community. We can also be found on our hive community & peakd as well as on my Discord Server
Felicitaciones, su publication ha sido votado por @scilwa. También puedo ser encontrado en nuestra comunidad de colmena y Peakd así como en mi servidor de discordia
Understanding top-down analysis in the crypto market Is a great article
Good to know more about Understanding top-down analysis in the crypto market. Thanks for sharing with us.
You have given a nice explanation on top down analysis in the cryptomarket.
Thanks for sharing with us 😊