Trendline and its importance in the candlestick chart
Greetings dear friends and welcome to my blog once again. It is a great pleasure to write here in this community once again. In today's article, we will be looking at the trendline and its importance on the chart.
A trendline is a line drawn on the chart when the price of the asset is moving in a trend I.e if the price is moving upward or downward. When the price is moving in an uptrend, the trendline is usually drawn below the chart whereas if the price is in a downtrend the trendline is drawn at the top of the chart.
Now, it is important to mention here that a trendline is a line in which the price action always retests and touches during a movement be it upward or downward movement. When this line is touched, the price moves back to the initial direction of the trend.
So when placing a trade, it is always advisable to place your trade once the price hits the trendline to maximize all the available profits. The trend line always acts as a dynamic support or resistance in the chart depending on the trend of the market.
In an uptrend, we see the trendline acting as a dynamic support level whereas in a downtrend, we see the trendline acting as a dynamic resistance in the chart. Whichever is the case, the trendline acts as a very important tool. As a break, it means a change of trend.
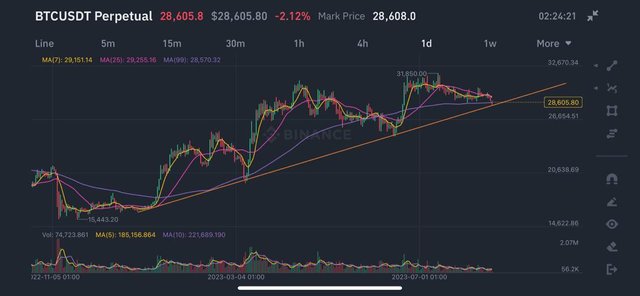
To draw an effective trendline, at least two or more of the body or wick of the already-formed candles must touch the trendline drawn else we will consider that trendline to be an invalid trendline. So always be sure that your trendline touches at least two or more points as seen in the image above.
More also, if you look at the trendline in the chart above closely, you will notice that anytime the price reaches it, there is always an impulsive movement back to the direction of the trend. This is how to know if you are still in the same trend or if there is a change if structure.
For you to trade the reversal, you must wait for a clear breakout of the trendline. When the trendline breaks, most times, a retest is seen back to the trendline and then an impulsive movement is also seen to confirm that the said trend has changed. So their friends always trade using this method as it is very effective.
I trade trendlines most often as it is one of the most effective and profitable ways of trading the financial market. So firstly try to learn how to draw an effective trendline and then be able to see that it is well drawn when the retracement touched the line back when it comes to it again.
This way, your position and your trade entry will be very beautiful and you will make a lot of money and profit using the trendline approach. I hope this pays out well for anyone who wishes to give it a try. Until then, I wish you all a successful trading journey.
Disclaimer: This post is made as an education and not investment advice. Digital asset prices are subject to change. All forms of crypto investment have a high risk. I am not a financial advisor, before jumping to any conclusions in this matter please do your research and consult a financial advisor.
Upvoted! Thank you for supporting witness @jswit.
Good to know about trendline and it’s importance.
Very important speech you shared with us.
Trendline and its importance in the candlestick chart shared a very important topic. I enjoyed reading your post.
This is a nice post containing trendline and it's importance in the candlestick chart.
Thanks for sharing with us 😊👍
Trendline and its importance in the candlestick chart is a great content.