Candles patterns that identify Trend Reversal. (Bullish and Bearish Engulfing)
As promised in my article two days ago, I will be discussing in-depth some of the trend-reversal patterns one after the other for more clarity and on this day, I will like to start with the bullish and bearish engulfing patterns.
This is one of the candle stick patterns you see often in a chart that tells you that a particular trend has come to an end and a new trend is about to start. We have already discussed the different trends we are having and what they look like but for the sake of others reading this article of mine for the first time, I will briefly explain.
We have the trending movement and the sideways movement in a chart. Trending movement can be an uptrend or downtrend whereas sideways movement is a movement that is in a range i.e. it is either upward or downward.
That being said, let's look at the trend reversal pattern that gives you the opportunity to long or short the market. As you know, in the crypto market you can make money either by buying or selling which means that even if the market is going down or moving up you can still make money.
Bullish Engulfing Pattern
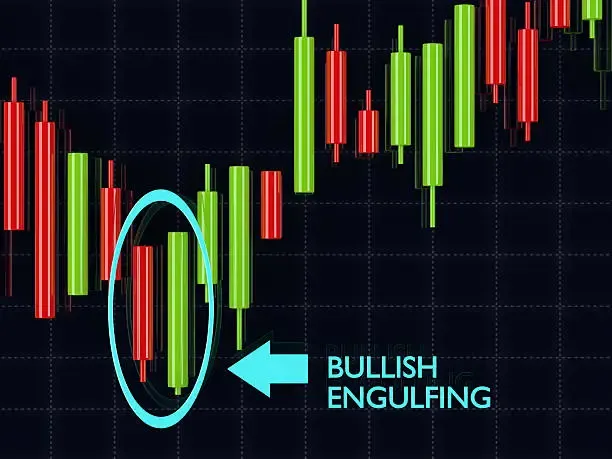
The bullish engulfing pattern is a pattern that is mostly seen at the support level of a chart indicating that the price of the asset is about to skyrocket 🚀 upward. This pattern as the name implies means that there will be two candlesticks, the first is a bearish candle stick and the second will be a bullish candlestick. The second is the bullish will engulf the first I.e it will completely cover the body of the bearish candle.
This means that buyers have taken complete control of the market and that sellers are no longer in charge. When you see such candles, you go ahead and long after the closing of the bullish candle and you will make good money at that point.
Bearish Engulfing Pattern
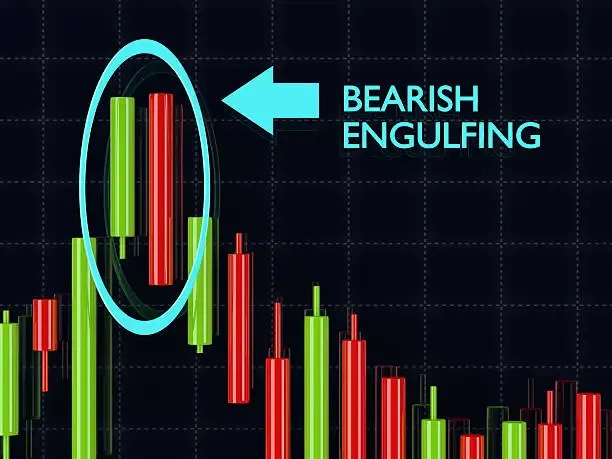
The bearish engulfing pattern is a pattern that is mostly seen at the resistance level of a chart indicating that the price of the asset is about to go downward. This pattern as the name implies means that there will be two candlesticks, the first is a bullish candle stick and the second will be a bearish candlestick. The second one which is bearish will engulf the first I.e it will completely cover the body of the bullish candle.
This means that sellers have taken complete control of the market and that buyers are no longer in charge. When you see such candles, you go ahead and short after the closing of the bearish candle and you will make good money at that point.
So you can see how this pattern helped you to make good money. The trading pattern is the best way to make good money in the crypto space. As I said earlier, you can make money in both ways either by buying or selling an asset. Remember, always long from the bottom to the top and always short from the top to the bottom.
Thank you, friend!


I'm @steem.history, who is steem witness.
Thank you for witnessvoting for me.
please click it!
(Go to https://steemit.com/~witnesses and type fbslo at the bottom of the page)
The weight is reduced because of the lack of Voting Power. If you vote for me as a witness, you can get my little vote.
Upvoted! Thank you for supporting witness @jswit.
Candles patterns that identify Trend Reversal. (Bullish and Bearish Engulfing) is a great post
This is a nice post on bullish and bearish engulfing candlestick patterns