Steem Total Value Powered Up - $37 million - October 16, 2022
This is next in my series of posts reviewing the amount and value of powered up STEEM on the Steem blockchain. For previous posts, see the end of this entry.
Noteworthy in the last week |
|---|
- Week over week, the number of powered up STEEM increased by about 381K SP, or almost 1/4%.
- Over the course of the week, we saw six daily increases and six new highs in the number of staked STEEM.
- The modeled value gained ground against all comparison values except for USD. Changes ranged from -0.34%% against USD to 9.72% against SBD.
- In terms of all comparison values except for TRX and USD, the modeled value remains above its January 1 baseline.
- In terms of all comparison tokens except TRX and USD, the modeled value is above its long term average.
- This week (Sunday through Saturday) saw a total of 381K STEEM powered down, which is a decline of about 17% as compared to last week's 458K STEEM.
Here are the numbers as-of a few minutes ago |
|---|
Total value locked in powered-up STEEM (USD): $37,327,177.19
STEEM market cap $89,544,059.19
Locked value in terms of other tokens:
| token | price | locked value equivalent | Jan 1, 2022 | pct of Jan 1 baseline |
|---|---|---|---|---|
| tron | $0.06 | 608,558,898 | 809,173,538 | 75.21% |
| steem-dollars | $2.28 | 16,371,568 | 11,284,131 | 145.09% |
| bitcoin | $19,122.91 | 1,951 | 1,300 | 150.12% |
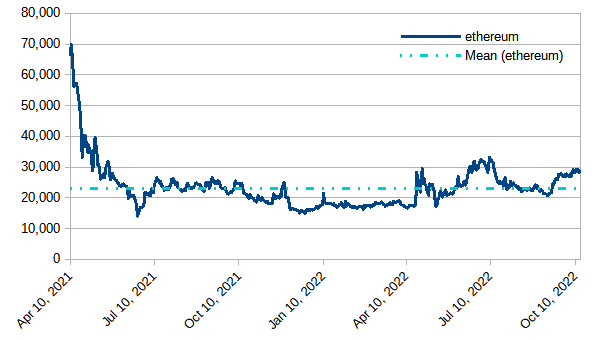
| ethereum | $1,282.48 | 29,105 | 16,501 | 176.39% |
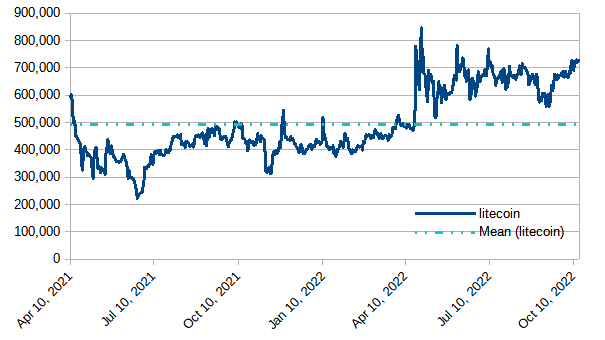
| litecoin | $50.91 | 733,199 | 411,561 | 178.15% |
| steem | $0.23 | 164,617,475 | 142,930,214 | 115.17% |
| USD | $1.00 | 37,327,177 | 61,837,042 | 60.36% |
|
|---|
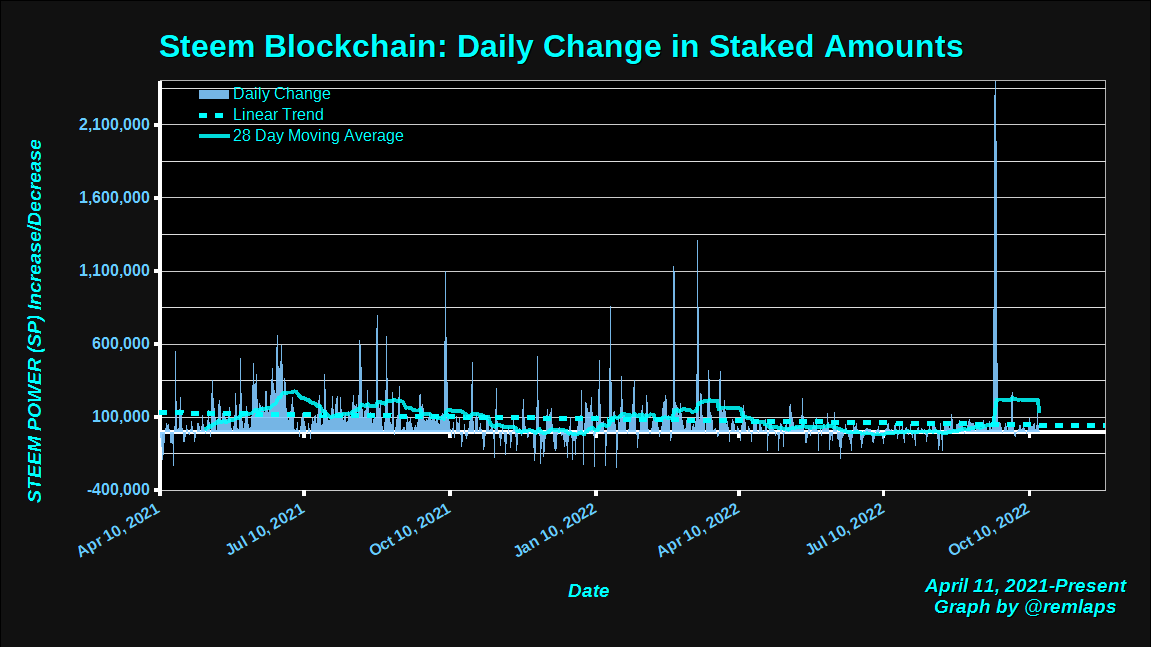
Daily Changes
Here is a chart of daily changes in powered-up STEEM from April 11, 2021 to present. The graph also includes a linear trend line and a 28 day moving average. The 28 day moving average is seeing a big drop as the mid-September power-ups by @hungry-griffin fall out of the range.
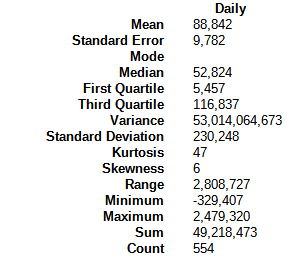
Here are some descriptive statistics, for numbers geeks.
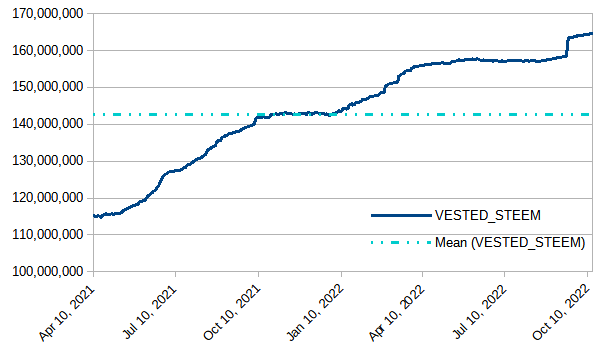
VESTED STEEM
Today's observed value was 164,613,698, which is up by ~381K from last week's observed value. The graph retains a slightly perceptible upslope.
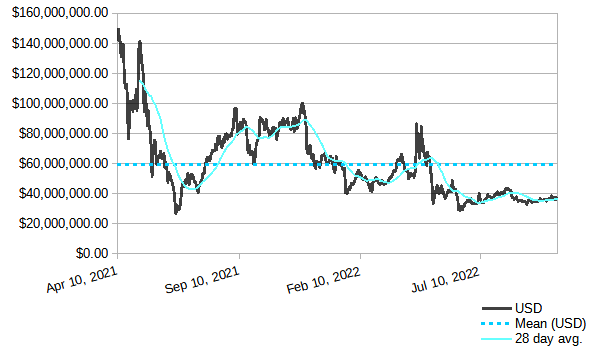
Modeled value of powered-up STEEM in terms of USD
In terms of USD, we saw a weekly decline of about $126K or roughly 1/3%. The value is still below the long-term mean, and holds above its recent low near $34 million. It also remains above the low of ~27 million from June 22, 2021.
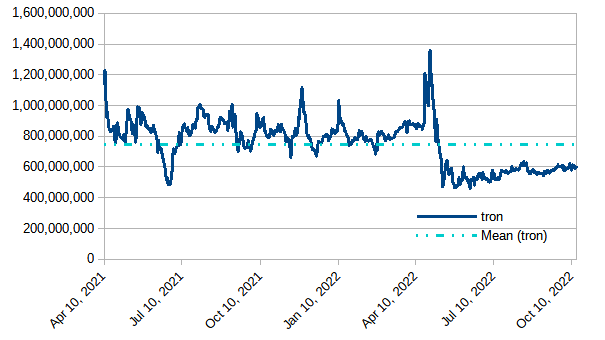
Modeled value of powered-up STEEM in terms of Tron (TRX)
Powered-up STEEM gained ground by about 10 million tokens against TRX or almost 1 2/3%.
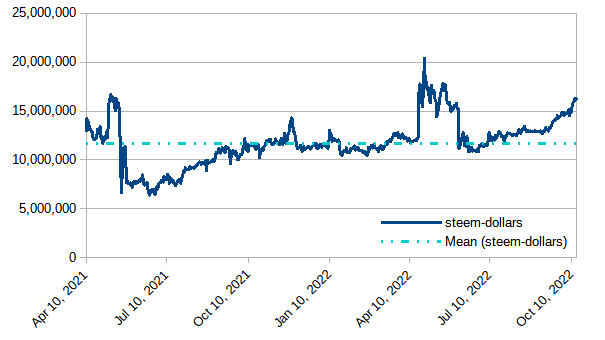
Modeled value of powered-up STEEM in terms of Steem Dollars
Up by almost 1 1/2 million SBDs or a nearly 10%
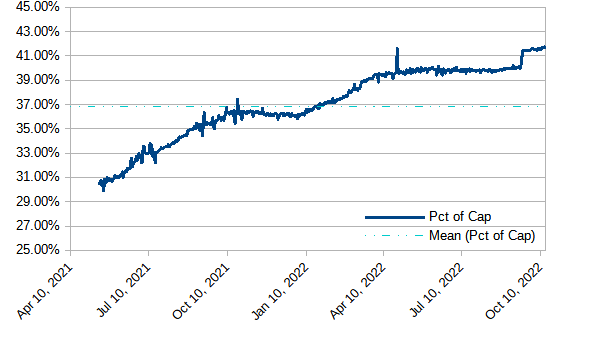
Modeled value of powered-up STEEM as a percentage of Steem's market cap
After today's observed value of 41.67%, the graph shows a slight upslope. We also saw a new high of 31.73% on October 14 (Friday). We have now seen 28 consecutive days above 41%; 195 consecutive days above 39%; 259 consecutive days above 37%; 386 consecutive days above 35%; and 449 straight days above 1/3. Will it hold above 41%? Will it climb above 42%
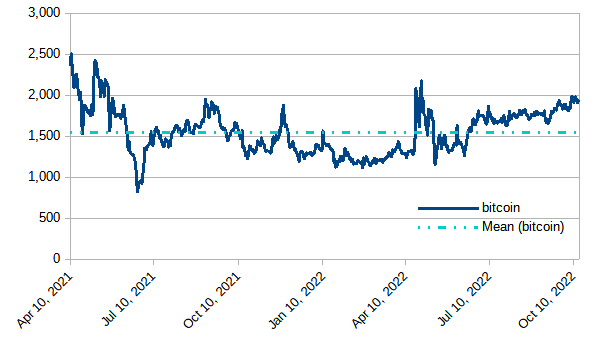
Modeled value of powered-up STEEM in terms of bitcoin (BTC)
Up by about 27 BTC, or almost 1 1/2% during the week.
Modeled value of powered-up STEEM in terms of Ethereum
Powered-up STEEM advanced by roughly 745 ETH, or a little over 2 1/2%.
Modeled value of powered-up STEEM in terms of LTC
Gained ground by about 32K, or a bit over 4 1/2%.
Daily Powerdown Activity
Here is graph with data from steemdb.io to show daily completed and pending powerdown activity. With 381K in completed powerdowns last week and 358K pending (both measured from Sunday through Saturday), we can expect powerdowns to decrease next week by about 5 1/2% or more.
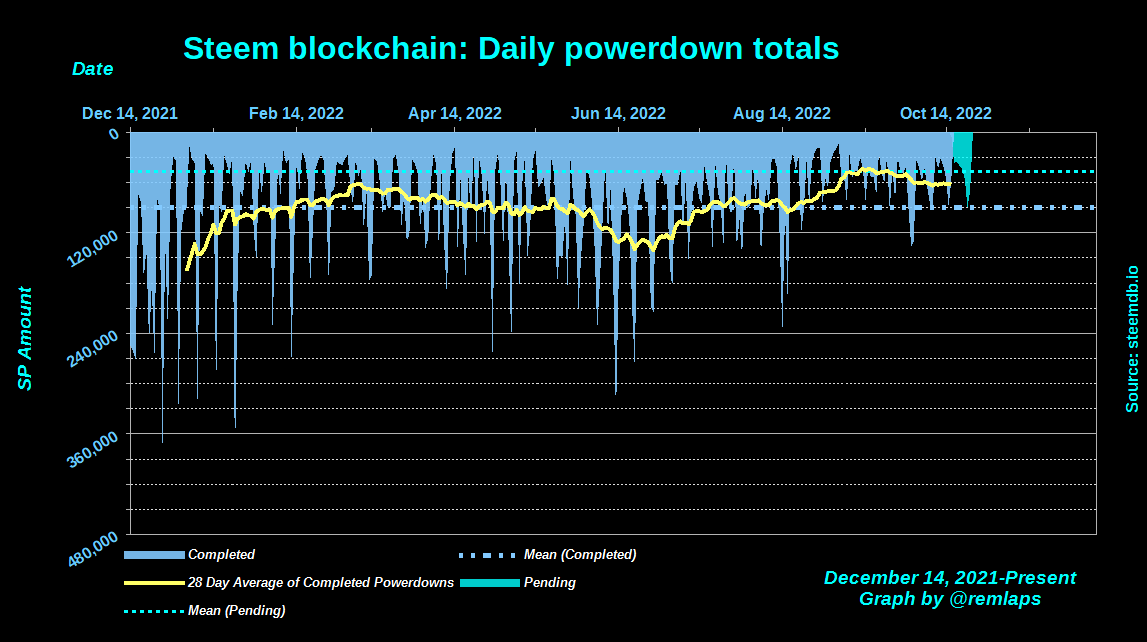
The horizontal lines are the average values for completed (blue) and pending (cyan) powerdowns, and the yellow line is a 28 day moving average of completed powerdowns. "Pending" numbers now come from the Steemit API, not from steemdb.io.
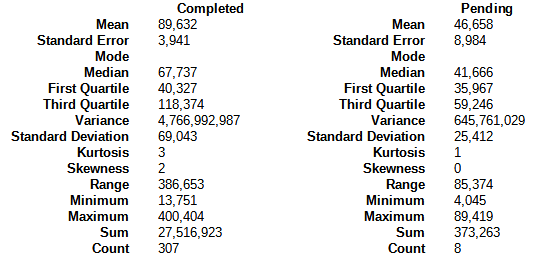
Here are some descriptive statistics for the numbers geeks
| And with a total of 1,233 pending power downs (down from 1,313 last week), here are the times, dates, and amounts of the top-10 |
|---|
1 2022-10-22T05:20:18 - 123,985,412 MVESTS, 69,051 STEEM
2 2022-10-23T16:02:15 - 84,307,551 MVESTS, 46,953 STEEM
3 2022-10-18T12:51:48 - 29,427,358 MVESTS, 16,389 STEEM
4 2022-10-21T11:11:21 - 21,324,320 MVESTS, 11,876 STEEM
5 2022-10-21T11:10:57 - 16,897,684 MVESTS, 9,411 STEEM
6 2022-10-21T16:15:57 - 13,071,148 MVESTS, 7,280 STEEM
7 2022-10-20T19:30:51 - 11,019,911 MVESTS, 6,137 STEEM
8 2022-10-20T19:47:09 - 8,499,529 MVESTS, 4,734 STEEM
9 2022-10-23T15:32:48 - 7,213,137 MVESTS, 4,017 STEEM
10 2022-10-20T21:22:33 - 6,845,010 MVESTS, 3,812 STEEM
Notes
- Reference prices for STEEM and other tokens are downloaded from coingecko.com
Previous posts
- Steem Total Value Powered Up - $34 million - July 3, 2022
- Steem Total Value Powered Up - $37 million - July 10, 2022
- Steem Total Value Powered Up - $36 million - July 17, 2022
- Steem Total Value Powered Up - $38 million - July 24, 2022
- Steem Total Value Powered Up - $41 million - July 31, 2022
- Steem Total Value Powered Up - $41 million - August 7, 2022
- Steem Total Value Powered Up - $43 million - August 14, 2022
- Steem Total Value Powered Up - $38 million - August 21, 2022
- Steem Total Value Powered Up - $36 million - August 28, 2022
- Steem Total Value Powered Up - $37 million - September 11, 2022
- Steem Total Value Powered Up - $36 million - September 18, 2022
- Steem Total Value Powered Up - $36 million - September 25, 2022
- Steem Total Value Powered Up - $35 million - October 2, 2022
- Steem Total Value Powered Up - $38 million - October 9, 2022
- Steem Total Value Powered Up - $37 million - October 16, 2022
For links from 2021 and the first half of 2022, see these posts:
- Steem Total Value Powered Up - $67 million - January 2,
20212022 - Steem Total Value Powered Up - $36 million - June 26, 2022
- Steem Total Value Powered Up - $36 million - June 26, 2022

Pixabay license, source
Reminder
Visit the /promoted page and #burnsteem25 to support the inflation-fighters who are helping to enable decentralized regulation of Steem token supply growth.
An interesting coincidence that the power-up increase matched the power downs !
Yeah, it is. I thought I had a typo at first.
At the moment, I am observing a decline in the price on the stock exchange, it is worth buying) The price will definitely grow up! thanks for the report
Oh, yes, I also watched 6 great jumps up the price of steem and it's great. Thank you for another informative report
Something unusual in relation to the increase and the decrease
overall a great performance. This is a long process and it must be sustained decisively.
This post has been featured in the latest edition of Steem News...