Deriving Crowd Psychology from Bars

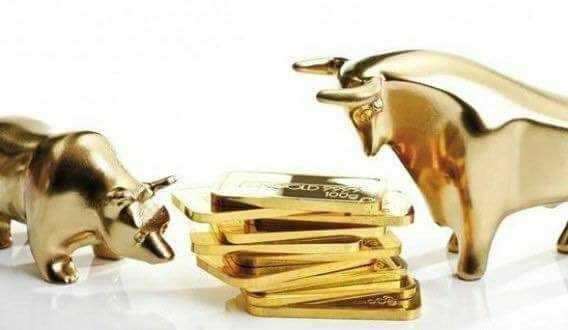
Price အေၾကာင္းမေျပာခင္ သိရမွာက Two types of Crowd။ ပထမအုပ္စုက ႏြားအုပ္/Bullsေတြျဖစ္ၿပီး၊ ေနာက္တစ္ဖြဲ့ကေတာ့ ဝက္ဝံ/Bearsေတြျဖစ္ပါတယ္။ Bullsေတြဟာ ေစ်းတက္မယ္ဆိုၿပီး အေကာင္းျမင္တဲ့ အုပ္စုပါ။ Bearsေတြကေတာ့ ေစ်းက်မယ္ဆိုတဲ့ အဆိုးျမင္အုပ္စု။ Investingစလုပ္လုပ္ခ်င္းေတာ့ Bearမျဖစ္ေသးတာေကာင္းပါတယ္။ ဒီေတာ့ for now, let's stick to Bulls. Professionalsေတြဟာ ေစ်းတက္ေတာ့မယ္ထင္ရင္ Currency OR Gold Price ကို Bullishျ>quoteဖစ္တယ္ေျပာေလ့ရွိသလို၊ ေစ်းက်ေတာ့မယ္ထင္ရင္ Bearishျဖစ္တယ္ ေျပာတတ္တယ္။ အခုလို Marketဟာ ျဖည္းျဖည္းခ်င္းတက္ေနရင္ Bull Marketလို့ေခၚသလို ဆက္တိုက္က်ေနၿပီဆိုရင္လည္း Bear Marketလို့ ေခၚၾကပါတယ္။
TAမွာ Priceနဲ့ Volumeကို Chartအမ်ိဳးမ်ိဳးနဲ့ Representလုပ္ၾကတယ္။ သတင္းစာတို့ CNBCတို့လို Mediaေတြမွာ ေဖာ္ျပေလ့ရွိတာက Line Chartပါ။ Line Chartဟာ Generally close priceကို သံုးၿပီး အဆြဲခံရေလ့ရွိပါတယ္။ Close Priceဆိုေတာ့ ဘာမ်ားရွိေသးလည္းလို့ ေမးလို့ရတယ္။ တကယ္တမ္းေတာ့ Periodတစ္ခုအတြက္ အျမဲတမ္း Price ေလးမ်ိဳးရွိပါတယ္။ Open, High, Low, Closeလို့ေခၚတယ္။ အတိုေကာက္ OHLCလို့ ေခၚၾကတယ္။ Openနဲ့ Closeကေတာ့ ရွင္းပါတယ္ - အဖြင့္နဲ့ ပိတ္တဲ့ေစ်းေပါ့။ Highနဲ့Lowကေတာ့ Periodတစ္ခုအတြက္ အျမင့္ဆံုးနဲ့ အနိမ့္ဆံုးျဖစ္ခဲ့တဲ့ ေစ်းေတြကို ဆိုလိုတယ္။ OHLC Bar Chartကမွ တကယ့္Professionalေတြသံုးၾကတဲ့ Typeပါ။ OHLCကို ဘယ္လို Representလုပ္သလည္း ၾကည့္ရေအာင္။
အေပၚကအပိုဒ္မွာ ကြ်န္ေတာ္ "Period တစ္ခုအတြက္" လို့ ေျပာေျပာသြားတာ ေတြ့ပါလိမ့္မယ္။ Periodလို့ ဘာလို့ေျပာရသလည္းဆိုေတာ့ သူဟာ အမ်ိဳးမ်ိဳးျဖစ္ႏိုင္တယ္ - 5min, 15min, 1hr, 1day, 1week, 1month အစရွိသျဖင့္ေပါ့။ ဒါေၾကာင့္ တစ္ေန့အတြင္းလို့ဆိုတာထက္ Period တစ္ခုအတြက္လို့ ေျပာတာပိုမွန္တယ္။ OHLC Barမွာ Openက ဘယ္ဘက္ကို လွည့္ၿပီး၊ Closeက ညာဘက္ကို ဦးတည္တယ္။ Barရဲ့ အျမင့္ဆံုး Pointဟာ Highျဖစ္ၿပီး၊ အနိမ့္ဆံုးဟာ Lowျဖစ္ပါတယ္။
TAကိုသံုးတဲ့အခါ FAလိုပဲ ဘယ္လို Translateလုပ္ရမလည္း သိဖို့လိုတယ္။ အဲဒီ့ Interpretationဟာ Traderတစ္ေယာက္နဲ့တစ္ေယာက္ၾကား ကြဲျပားသြားေစမယ့္ အရာေတြပါပဲ။ Generallyကေတာ့ Openဟာ Amateurေတြကို ကုိယ္စားျပဳတယ္ - Professionalေတြဟာလည္း ဖြင့္ဖြင့္ခ်င္းပါႏိုင္ေပမယ့္ Normallyကေတာ့ သူတို့ဟာ အေတြ့အၾကံဳမရွိေသးတဲ့လူေတြ၊ ေလာၾကီးတဲ့သူေတြကို ေပးဖြင့္ေလ့ရွိၾကပါတယ္။ Highဟာ Bullsေတြကို ကိုယ္စားျပဳတယ္ - ေစ်းတက္မယ္ထင္လို့ ဝယ္ရင္းဝယ္ရင္းနဲ့ ေစ်းကို ျမွင့္တင္တဲ့ အုပ္စုပါ။ ေျပာင္းျပန္ကေတာ့ Lowကို ျဖစ္ေစတဲ့ Bearsေတြပါ။ သူတို့ဟာ ေစ်းက်မယ္ဆိုတဲ့အျမင္နဲ့ ေရာင္းရင္းနဲ့ပဲ Lowကို ျဖစ္ေစႏိုင္ပါတယ္။ Closeဟာ အေရးအၾကီးဆံုးျဖစ္သလို Professionalေတြ၊ Institutionsေတြက ပိတ္ေစ်းကို Defineလုပ္ေလ့ရွိတယ္လို့ ဆိုပါတယ္။ စိတ္ရွည္ရွည္နဲ့ တေနကုန္ေစာင့္ၾကည့္လာၿပီး ေစ်းပိတ္ခါနီးမွ ဝယ္လာတတ္တဲ့သူအမ်ားစုဟာ Proေတြ၊ Institutionsေတြ မ်ားပါတယ္။ ေအာက္မွာ ျဖစ္ႏိုင္တဲ့ OHLCေတြနဲ့တကြ အဲဒီ့ Periodကေန Crowd Psychologyကို ဘယ္လို Deriveလုပ္ရမလည္းဆိုတာ ရွင္းျပထားပါတယ္။ Periodကိုေတာ့ Daily Barေတြလို့ ယူဆလိုက္ပါ။
Bullishျဖစ္တဲ့ေန့ - Closeဟာ မေန့က Closeထက္ ပိုျမင့္တယ္။ Closeဟာ Highနဲ့ တူခ်င္တူမယ္၊ နည္းနည္းပိုက်ခ်င္က်မယ္။ အမ်ားၾကီးေတာ့ မကြာဘူး။ Closeဟာ Openထက္ ျမင့္ရင္ ပိုေကာင္းပါတယ္။
Bearishျဖစ္တဲ့ေန့ - Closeဟာ မေန့က Closeထက္ ပိုနိမ့္တယ္။ Closeဟာ Lowနဲ့ တူခ်င္တူမယ္၊ နည္းနည္းပိုျမင့္ခ်င္ျမင့္မယ္။ အမ်ားၾကီးေတာ့ မကြာဘူး။ Closeဟာ Openထက္ နိမ့္ရင္ ပိုBearishျဖစ္ပါတယ္။
Very Bullishေန့ - Closeဟာ မေန့က Closeထက္ ပိုျမင့္တယ္။ Openနဲ့ Closeဟာ Highနဲ့ မတိမ္းမယိမ္းပဲ ရွိေနၾကမယ္။ Highဟာ မေန့ကHighထက္ျမင့္ရင္ ပိုေကာင္းတယ္။
Very Bearishေန့ - Closeဟာ မေန့က Closeထက္ ပိုနိမ့္တယ္။ Openနဲ့ Closeဟာ Lowနဲ့ မတိမ္းမယိမ္းပဲ ရွိေနၾကမယ္။ Lowဟာ မေန့ကLowထက္နိမ့္ရင္ အဆိုးဆံုးပဲ။
အဖ်ား႐ွုးသြားတဲ့ Bullishေန့ - Closeဟာ မေန့က Closeထက္ ပိုျမင့္တယ္။ ဒါေပမယ့္ Closeဟာ Openထက္ပိုနိမ့္တယ္။ ဒါဟာဘာကိုျပလည္းဆိုေတာ့ ေစ်းသာတက္တာ သိပ္ေတာ့ မဟန္ဘူးလို့ဆိုလိုတယ္။ မနက္ျဖန္မွာ ျပန္က်ႏိုင္ပါတယ္။ အလယ္က Barကို Focusလုပ္ပါ။
သိပ္မဆိုးတဲ့ Bearishေန့ - Closeဟာ မေန့က Closeထက္ ပိုနိမ့္တယ္။ ဒါေပမယ့္ Closeဟာ Openထက္ပိုျမင့္တယ္။ ဒါဟာဘာကိုျပလည္းဆိုေတာ့ ေစ်းသာက်တာ အဆံုးသတ္က်ေတာ့ ထင္သေလာက္မဆိုးဘဲ ေစ်းတက္သြားတယ္၊ မနက္ျဖန္ ဆက္တက္ႏိုင္တယ္လို့ ဆိုလိုပါတယ္။ အလယ္က Barကို Focusလုပ္ပါ။
ဇေဝဇဝါ ျဖစ္ေနတဲ့ေန့ - OHLCေလးခုလံုးဟာ တစ္ခုနဲ့တစ္ခု သိပ္မကြာပဲ Barဟာ Plusလုိလို၊ Dashလိုလို ခပ္တိုတိုျဖစ္ေနပါလိမ့္မယ့္။ Bullနဲ့ Bearေတြ ဘာလုပ္ရမွန္းမသိပဲ သိပ္Activeမျဖစ္တဲ့ေန့ကို ဆိုလိုတယ္။
ေျပာဖို့က်န္ေသးတာက Volume။ Volumeကို ေအာက္ဘက္မွာ သပ္သပ္ျပေလ့ရွိပါတယ္။ Volumeဟာ Periodတစ္ခုအတြင္းမွာ ဘယ္ေလာက္ Units လက္ေျပာင္းလက္လႊဲျဖစ္ခဲ့သလည္းကို ေျပာပါတယ္။ အေပၚမွာ ေျပာခဲ့တဲ့ Interpretationေတြကို Volumeနဲ့ Confirmလုပ္ႏိုင္ပါတယ္။ ဥပမာ - Very Bullish Dayမွာ Volumeက Averageထက္ ေတာ္ေတာ္နည္းေနတယ္ဆိုရင္ ေစ်းသာတက္တယ္ ဝယ္လက္ဒီေလာက္မရွိခဲ့ဘူးလို့ ဆိုလိုပါတယ္။
Chic article. I learned a lot of interesting and cognitive. I'm screwed up with you, I'll be glad to reciprocal subscription))
This post has received a 3.13 % upvote from @drotto thanks to: @pulone.
Congratulations @pulone! You have completed the following achievement on Steemit and have been rewarded with new badge(s) :
Click on the badge to view your Board of Honor.
If you no longer want to receive notifications, reply to this comment with the word
STOPTo support your work, I also upvoted your post!
Do not miss the last post from @steemitboard:
SteemitBoard World Cup Contest - The results, the winners and the prizes
This post has received a 2.07% upvote from thanks to: @pulone!!!
For more information, click here!!!!
If you use our Robot before your post has 1 day and get an Upvote greater than 1%, you will automatically receive Upvotes between 1% and 10% as a bonus from our other robots.
Congratulations @pulone! You received a personal award!
You can view your badges on your Steem Board and compare to others on the Steem Ranking
Do not miss the last post from @steemitboard:
Vote for @Steemitboard as a witness to get one more award and increased upvotes!