Bitcoin Trend Series / EP. 638 / Further Losses in The Cards
Time: 8.07 A.M. / GM+2 / 29th June 2018 – Fri.
- In our post / 607 / dated on 29th May, we wrote;
We doubt the crucial support 7.100K - 7.210K area will hold as the 2 weekly bearish stop grabbers after breaking 7.614K, suggest drop below 6.519K, to test 5.878K reaching 4.300 area, where a Potential Bullish Reversal can take place.
- In our post / 631 / we wrote;
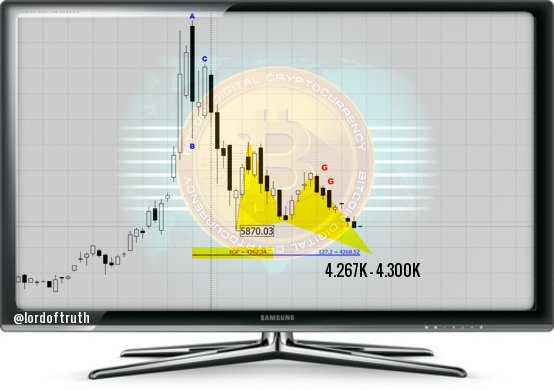
The Accumulated Stops below 5.878K will be triggered, and the price will accelerate lower, right to our destination at 4.300K Area / Butterfly "Buy" that appears on the below chart, within less than 2 weeks.
- Our Final Target around 4.300K has not been reached yet. Keep in mind 4.300K area is the point where bitcoin price should gravitate to, and the below Butterfly most likely will finalize this action.
Bitcoin Market has had a Rough Week as regulatory jitters have returned and risk appetite has been subdued.
Japan’s FSA stepped up its restrictions on exchanges related to AML and KYC checks and South Korea’s regulators appear to be following suit.
In our previous post / 637 / we had forecast the trading range will be between 5.500K & 6.575K. The intraday low was 5.822K and the high was 6.132K.
Bitcoin price resumes trading Below 6.039K as expected, paving the way to the next station located at 5.500K.
TA give mixed signals. RSI indicate that sellers are exhausted, Stochastic show that sellers might let buyers take over, while the Gab between 100SMA & 200SMA signal that Further Losses are in the cards.
Bitcoin Market holds Harmonic Swings, as you can see on below chart. So we still watching for bearish continuation patterns / "222" Sell.
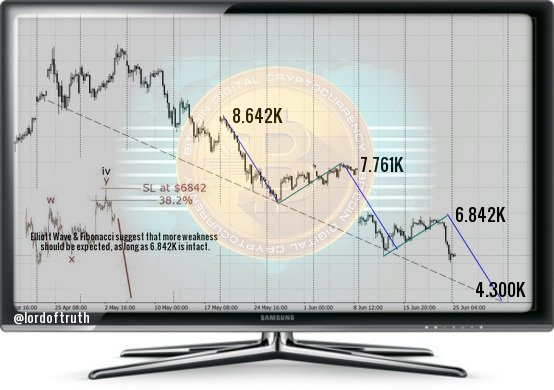
No Change to our bearish scenario, conditioned by the price stability Below 6.450K. So we still wait for more losses towards 5.500K followed by 4.300K Area / Butterfly "Buy" the final destination and the potential bullish reversal location.
At press time, bitcoin price is around 5.870K and our Bearish Journey continues as the bearish trend will remain dominant on the intraday and short term unless breaching 6.450K and settling above it.
We suggest / Bearish Trend / for today.
Support 1: 5500.000 level.
Resistance1 : 6250.00 level.
Support 2: 4975.000 level.
Resistance2 : 6450.000 level.
Expected trading for today:
is between 5500.00 and 6250.00.
Expected trend for today :
Bearish.
Medium Term:
Neutral.
Long Term:
Bullish.
The low of 2018:
4267.00 / Expected.
The high of 2018 (BitcoinTrader's Year):
14469.00 / Expected.
The low of 2019: ???
The high of 2019 (Bitcoin Holder's Year):
36000.00 level / Expected.

investing considerable time and effort up front in
hopes of considerable returns down the road.
I'm so proud of my little blog, and so grateful to all of you
for support to keep it going.

Thanks, I really enjoed this. You really articulated your point. Great job.
This post has received a 10.37 % upvote from @booster thanks to: @lordoftruth.
Till now only your prediction is on point great trader you are thanks for sharing your knowledge with us all : )
I really like this post