Bitcoin TA - summary of analysts - 18. May 18
Regular daily update on BTC ta analysts opinions.

**My summary - short-term sentiment: bearish ** (last: bearish)

- We continue to go do and it seems the correction is not completed yet.
- Expected turnaround point is around 7'500 - 7'700 area.
- May is usually a strong month. Lets see how it plays out in 2018.

News about the blog
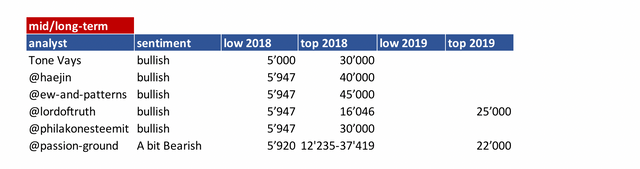
I need to revise my 2018 long term table. I need to add a 2018 and 2019 target an be more precise on the sentiment here. Will do that after I am back in Switzerland.
We lunched the bounty project beta. If you are interested and you like to create a bounty on your own have a look at this post
Analysts key statements:
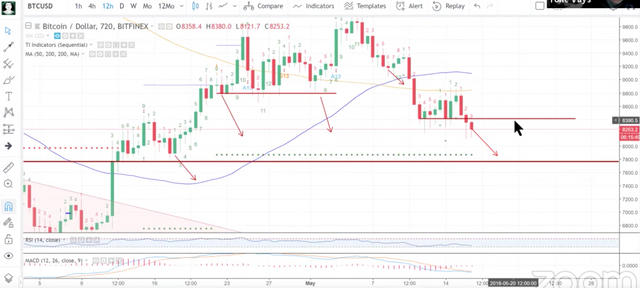
Tone:
- Weekly: Back under 8'300. Neutral week according TD. If next week is coming below this week we get a shorting opportunity. Below 30 and 7 MA. Below 50 MA he doesn't see much support till 4'975. The problem at that time we get there all MAs will move down which is a strong bear market signal which will last for a long time (last time it happens it took 1 year to flip back). He remains bearish.
- Daily: Looks very bearish. 7'600 is his first point of support which he expects to last not long.
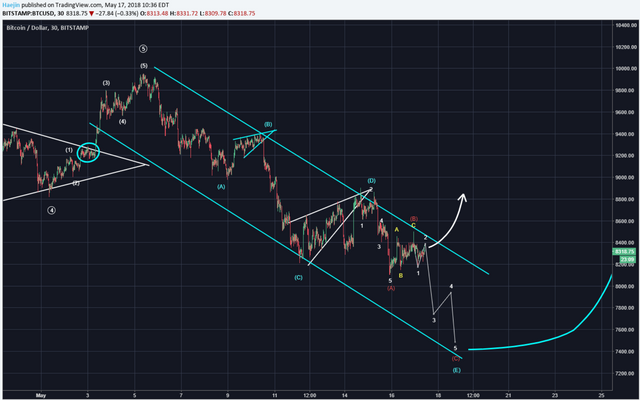
@haejin:
Yellow ABC, subwaves for red B, of blue E are likely complete.Yellow C was a price wick which came close to the upper blue trend line.
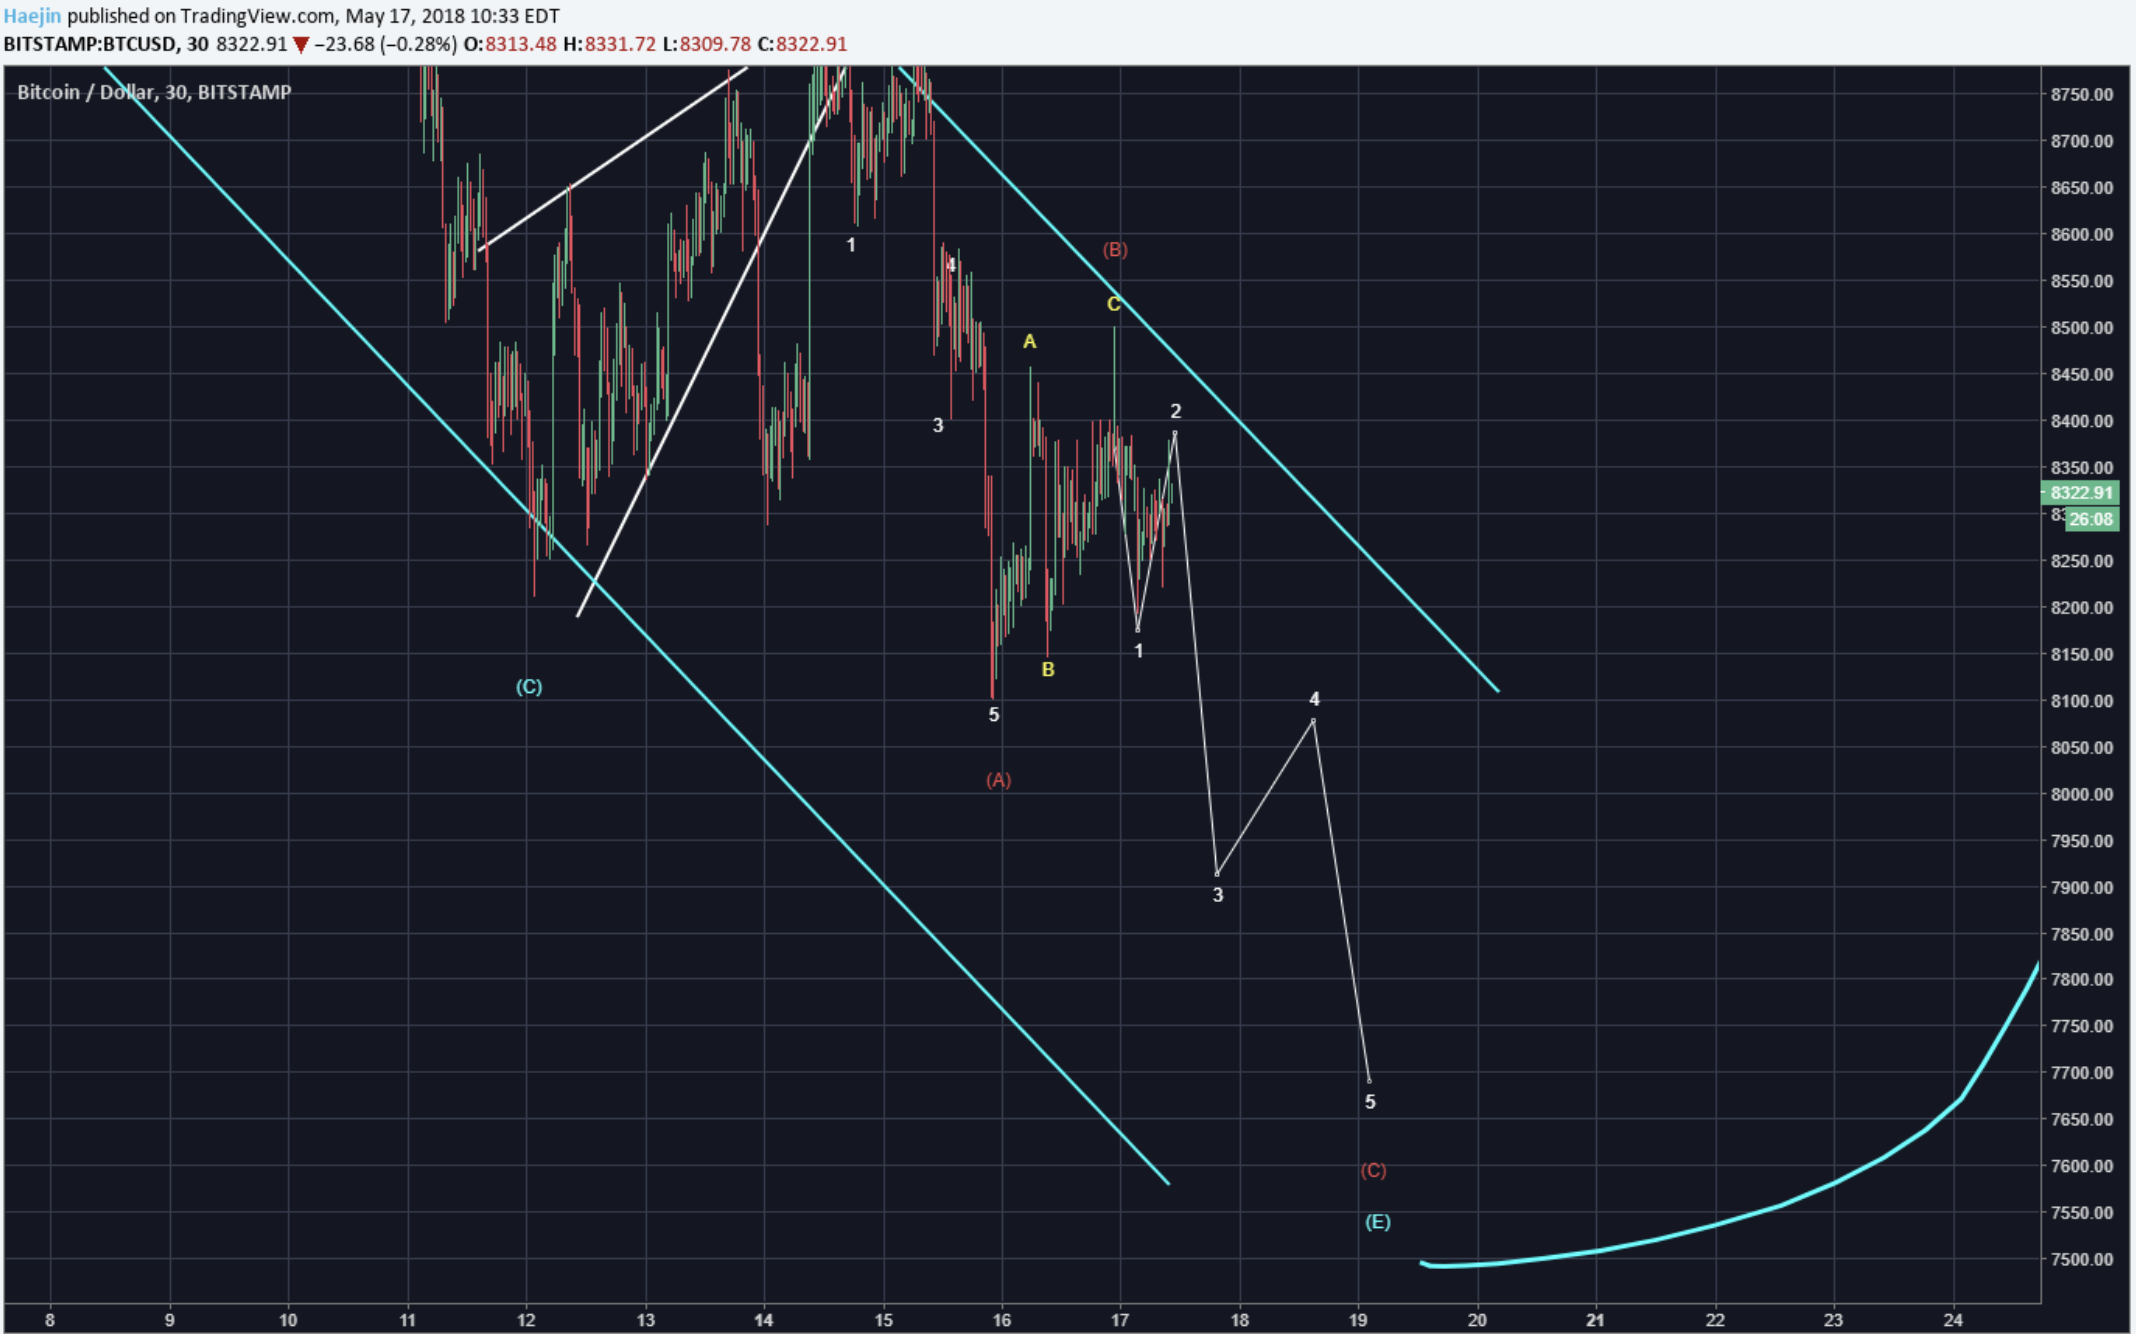
Price may break upper blue trend line and move up from here but more like continue towards lower low at 7'500 or so. This wave 3 down may start today.
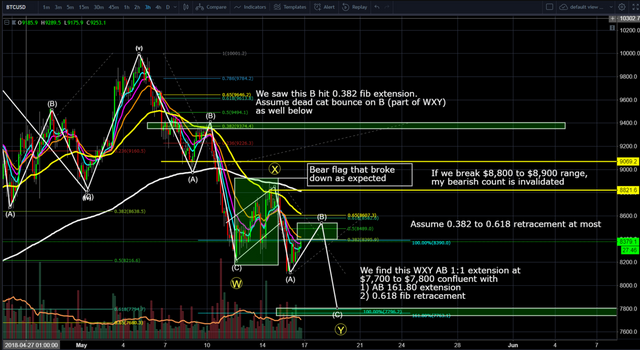
@ew-and-patterns:
Finally BTC has shown what the correction will look like. There are two ways to label this, but the result is absolutely 100% the same, so it doesn't matter much. It is either ABCDE or just ABC as a 3-3-5 flat correction.
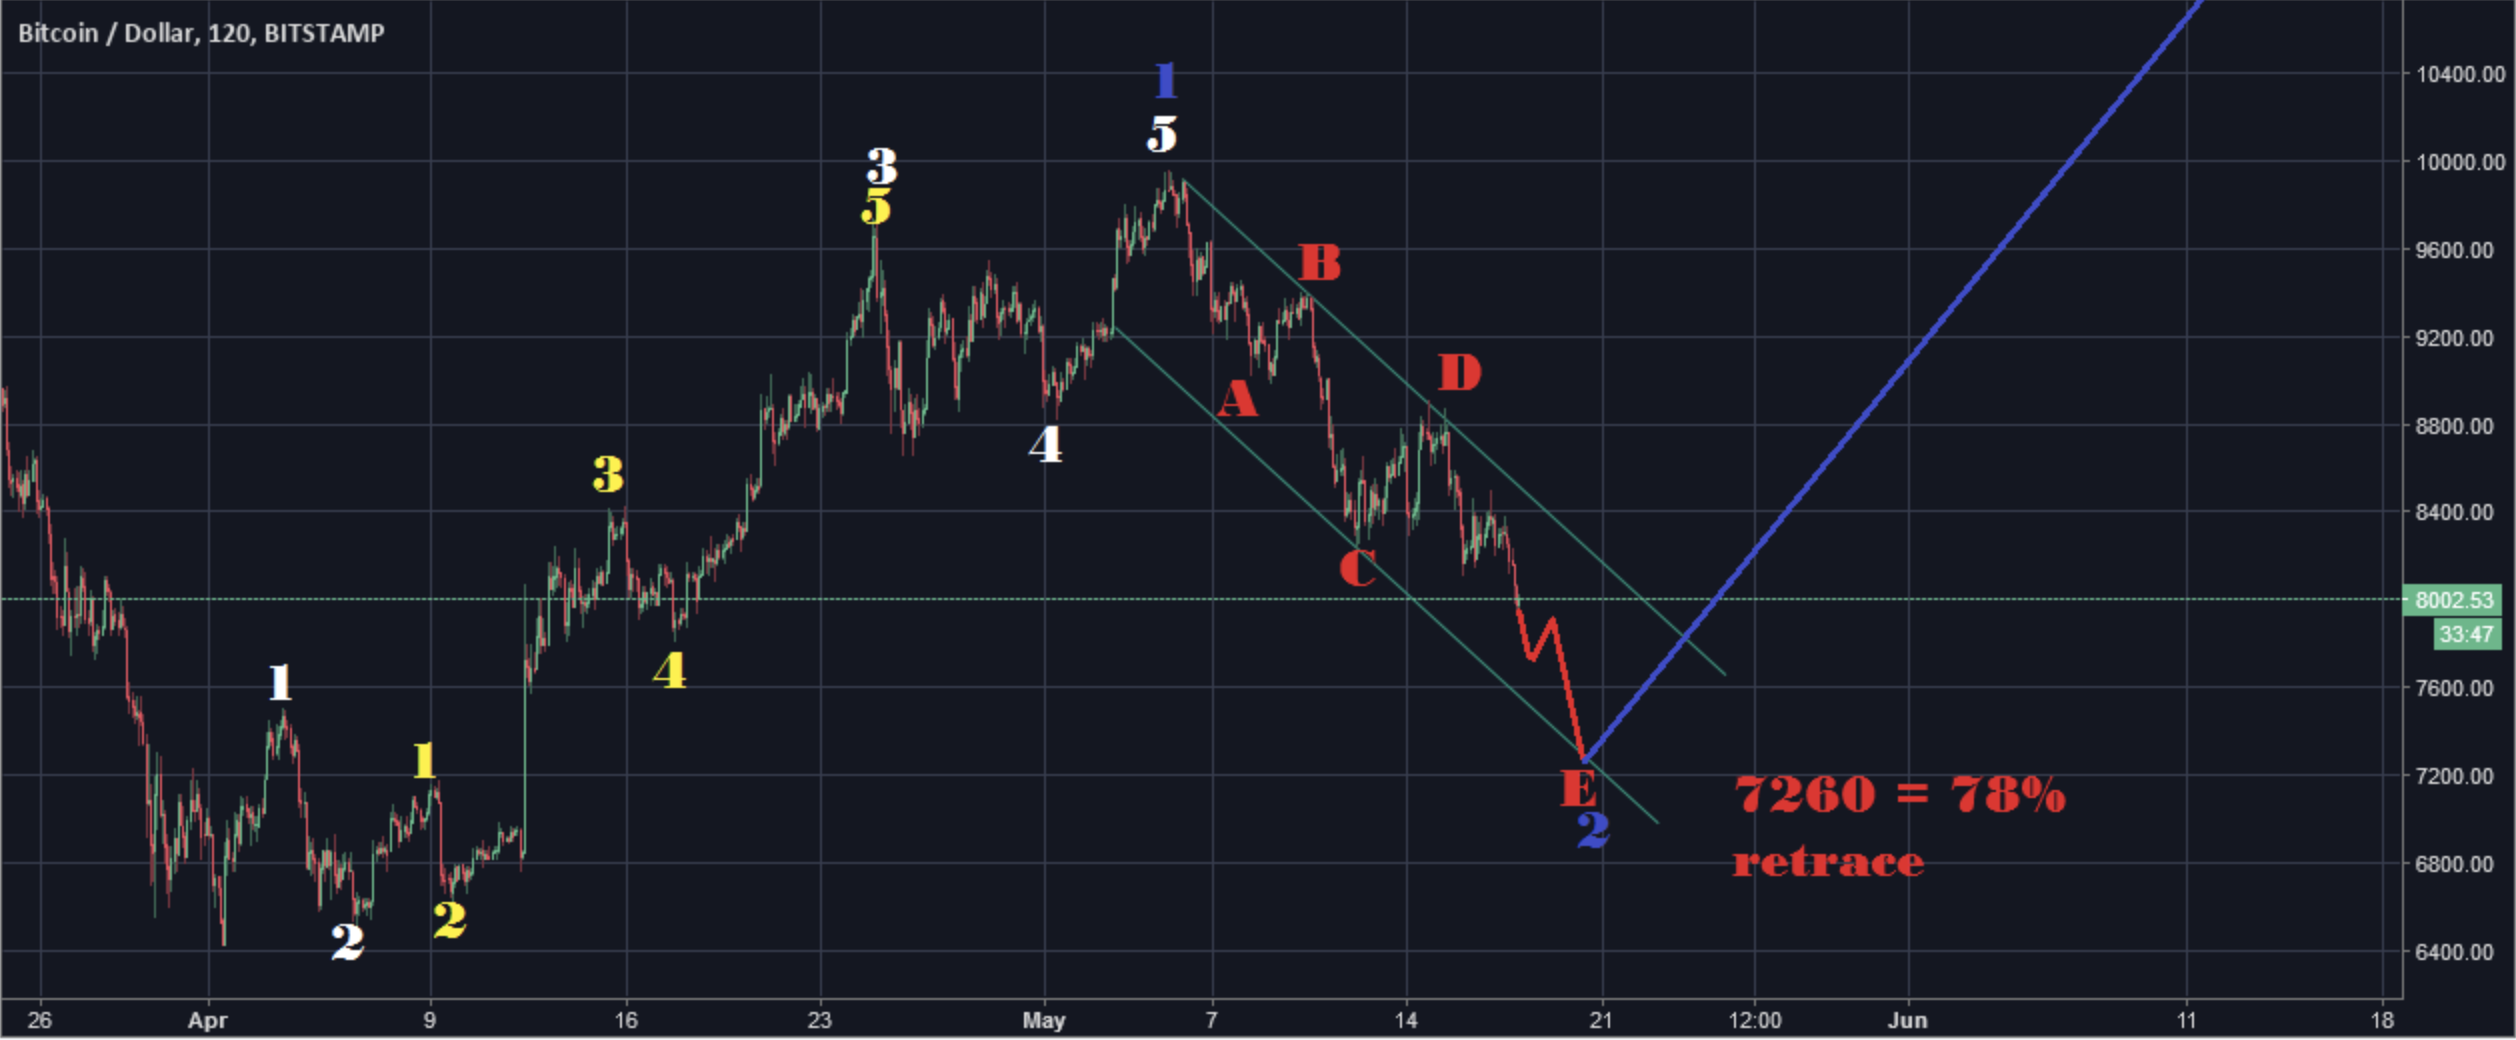
Now the target will likely be 7'260 (78% correction target for a wave 2).
At this point, there is a very high chance of an amazing rally starting off the bottom. BTC might rise 1'000 in only 1 hour. That's when you know that the correction is over. That is the point in time that institutional investors have been waiting for months now. The time for FOMO will be soon.
@lordoftruth:
Bitcoin price trades with clear negativity now around 8'000 , falling under continuous pressure coming by EMA50, trying to push the price towards 7'614 - 7'770 support area.
He sees signs that market will hold around 7'614 - 7'770 area (0.625 level).
If bitcoin price fail to turn up at around 7'770 level - 6'519 low will be broken.
Todays trend is slightly bullish. Trading between 7'614 and 8'643.
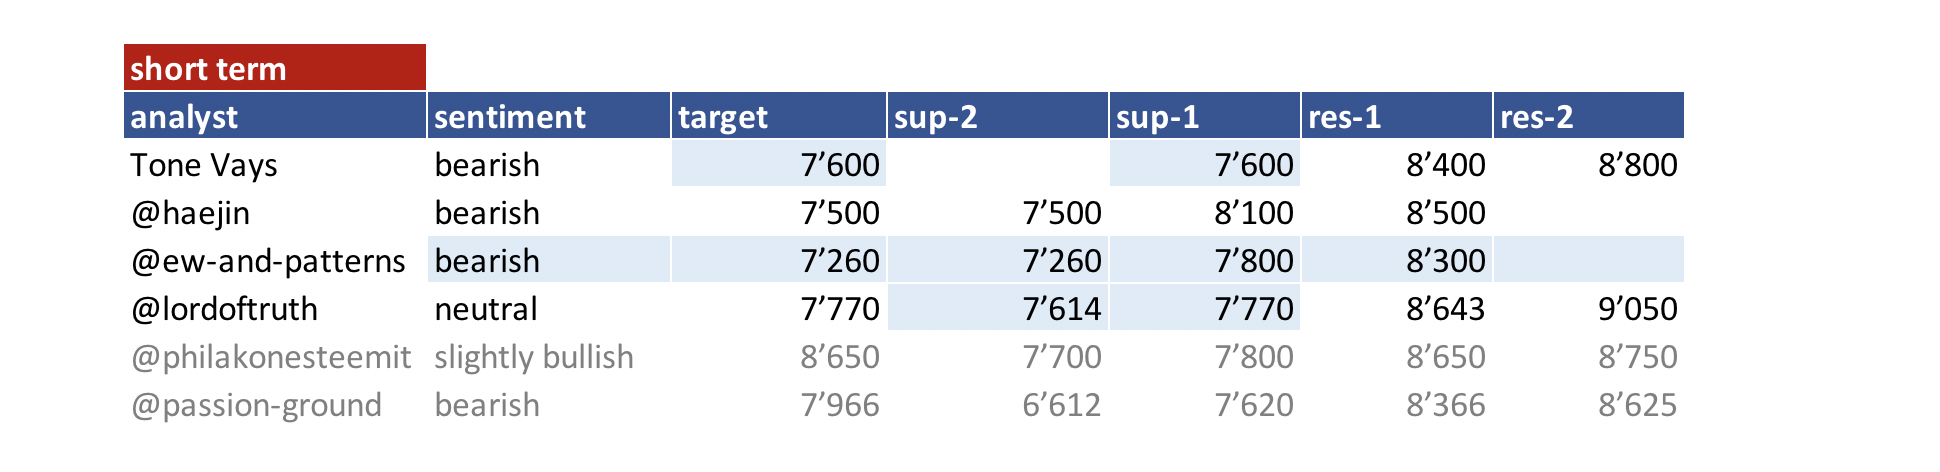
@philakonesteemit:
On the bearish side he sees retest of 8'650 to 8'750 range and than go down for 7'700 - 7'800.
On the bullish side, a break above 9'900 can signal a rally to 11'500, 11'750 range. Wave (3).
So it depends if we get rejected by 8'650 - 8'750 or if we directly go up.
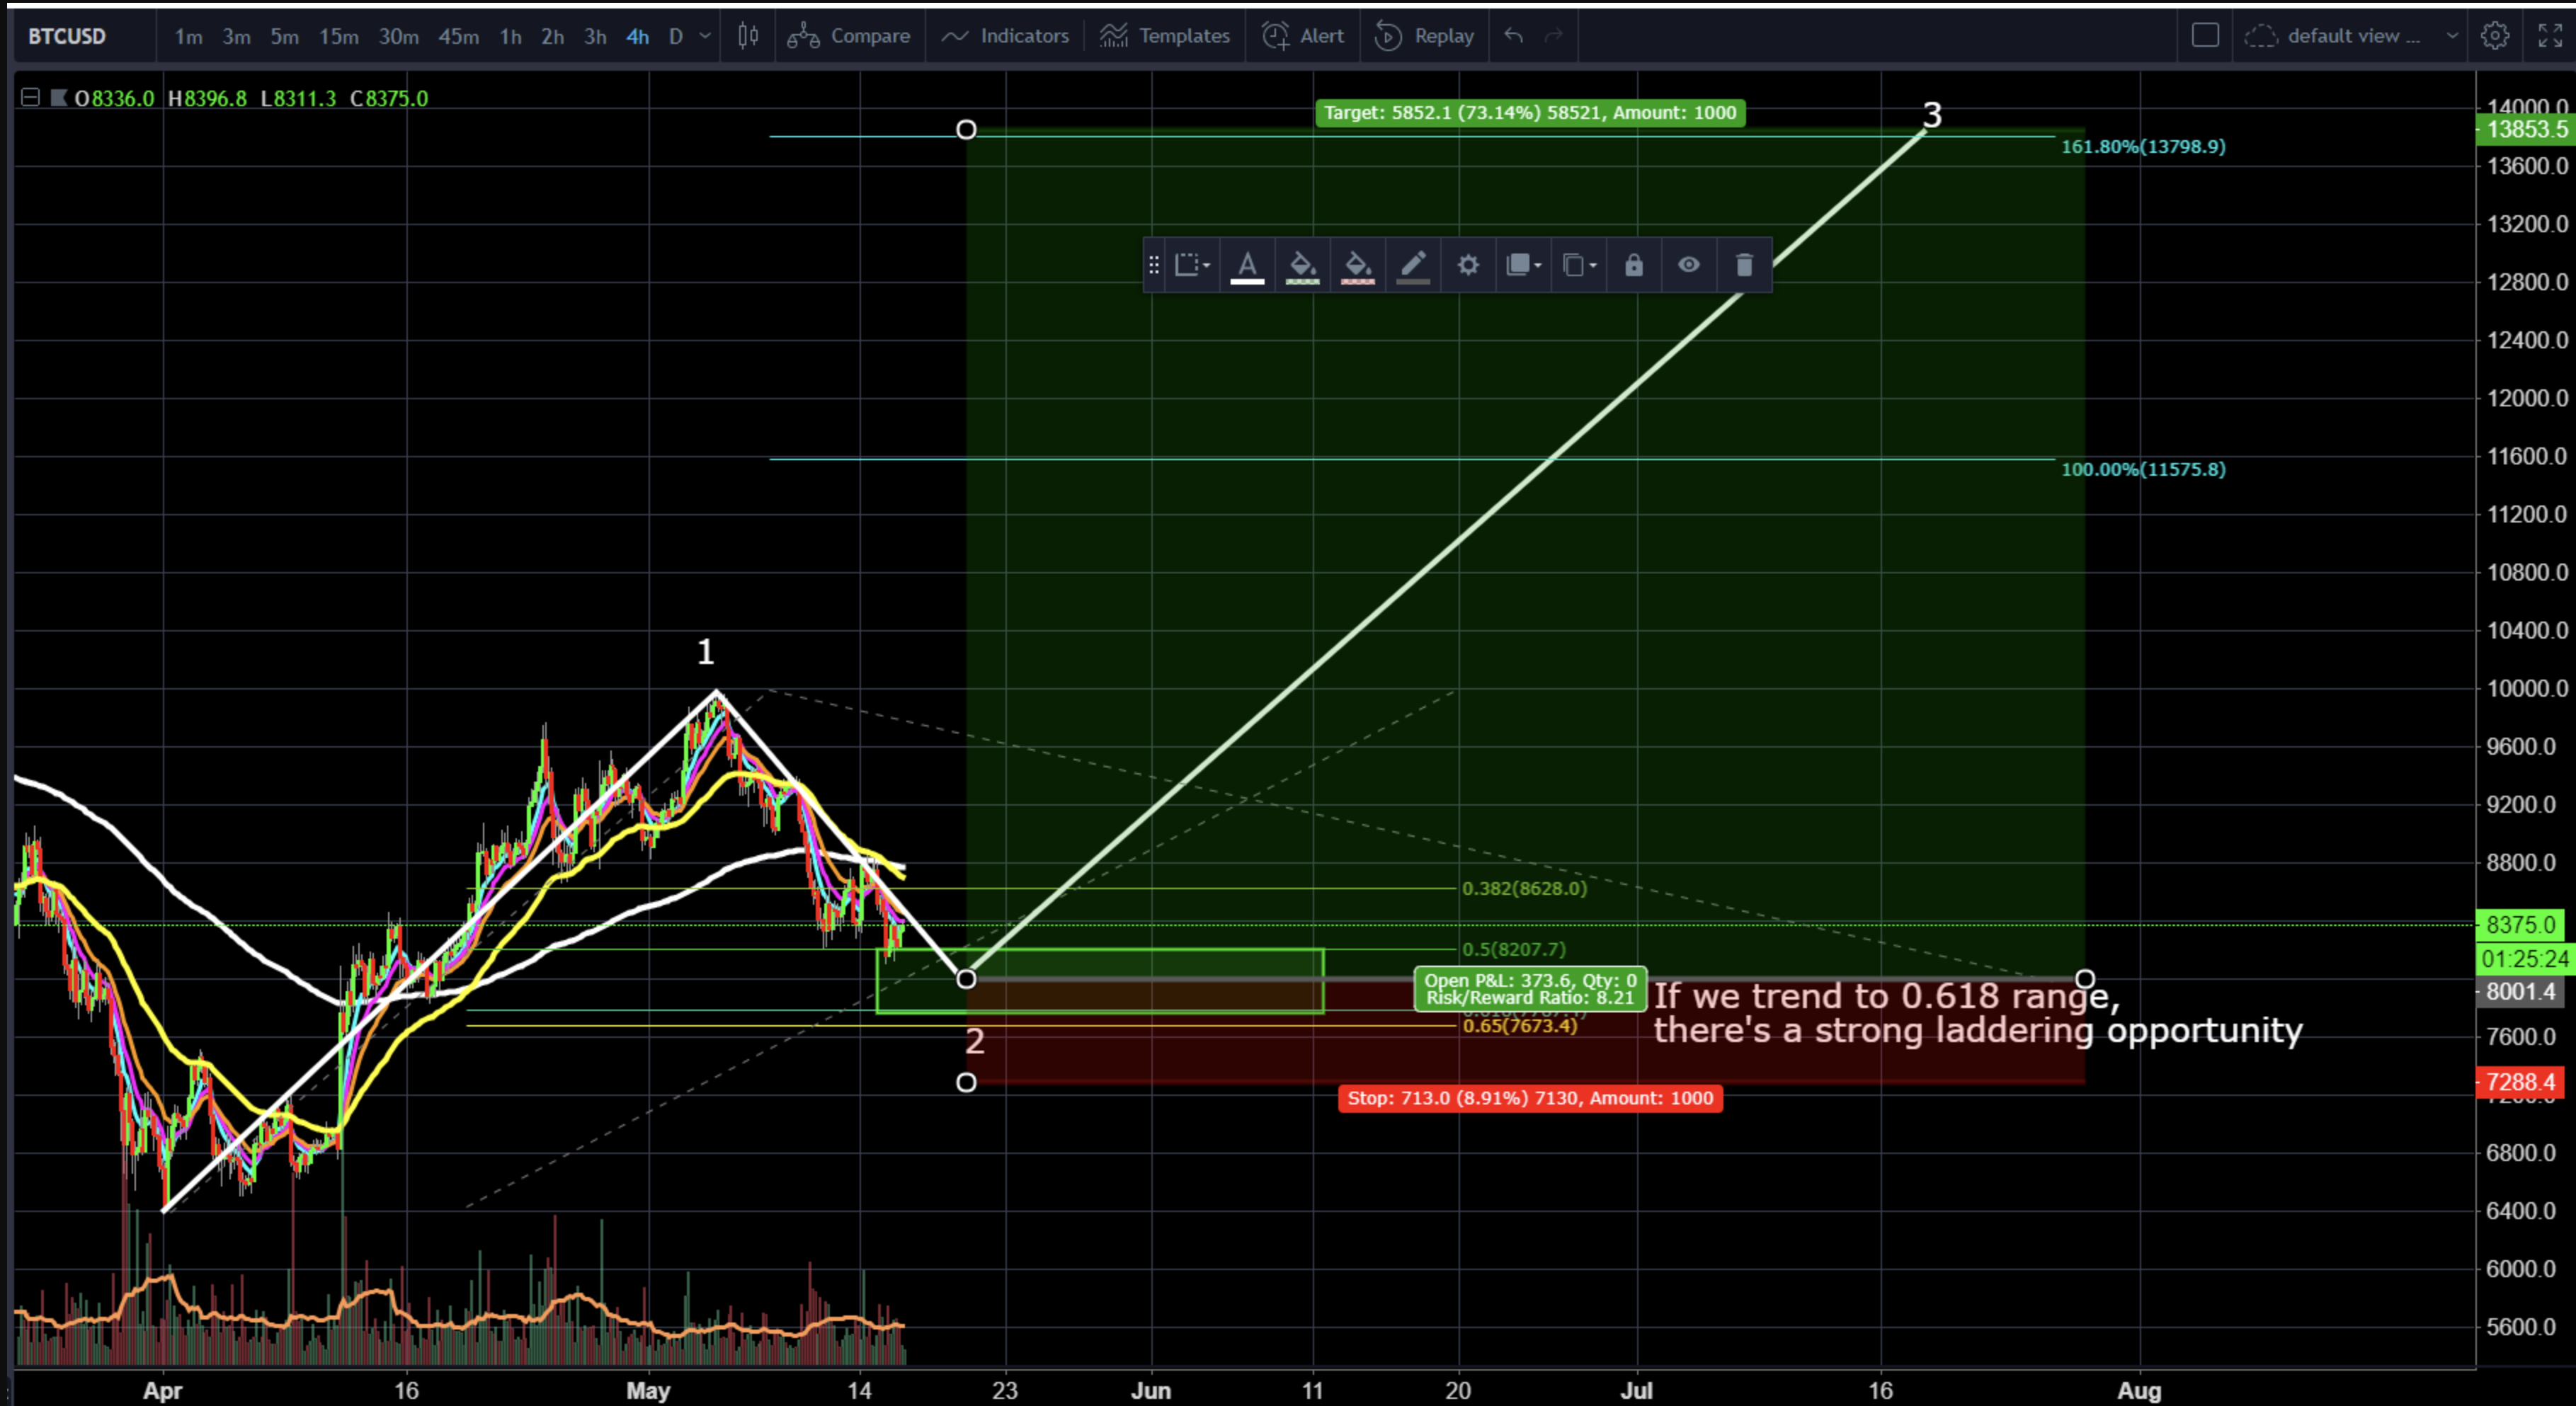
@passion-ground:
Although (basis the 4-hour chart) a bearish 5-wave impulsive decline off the recent 9'848 print high has manifested.From the current pullback low of 8'100, the 9'243 level (a .618 retracement thereof) becomes critical to observe.
If BTC is able to bullishly rally and “sustain” trade above 9'243 from here, it would then become highly likely that 8'100 would mark an interim low, and that we are on our way to riding a bullish 3rd wave up at the minute degree of trend.
If we get rejected instead would increase the likely hood of reaching the noted downside target of 7,966, or possibly lower before we mark the preferred bullish minute 2-wave down.
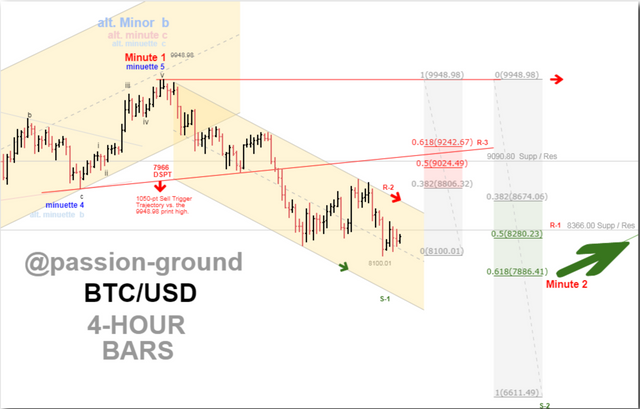
Summary of targets/support/resistance
Reference table
| analyst | latest content date | link to content for details |
|---|---|---|
| Tone Vays | 17. May | here |
| @haejin | 17. May | here |
| @ew-and-patterns | 18. May | here |
| @lordoftruth | 18. May | here |
| @philakonesteemit | 17. May | here |
| @passion-ground | 17. May | here |
Definition
- light blue highlighted = all content that changed since last update.
- sentiment = how in general the analysts see the current situation (bearish = lower prices more likely / bullish = higher prices more likely)
- target = the next (short term) price target an analysts mentions. This might be next day or in a few days. It might be that an analyst is bullish but sees a short term pull-back so giving nevertheless a lower (short term) target.
- support/res(istance) = Most significant support or resistances mentioned by the analysts. If those are breached a significant move to the upside or downside is expected.
- bottom = -> now renamed and moved to long term table. Low 2018
- low/top 2018 = what is the low or the top expected for 2018?
Further links for educational purposes:
- From @ToneVays: Learning trading
- From @philakonecrypto: Like in every post you find links to his amazing educational videos. For example here
- From @lordoftruth: Fibonacci Retracement
- From @haejin: Elliott Wave Counting Tutorial
*If you like me to add other analysts or add information please let me know in the comments.
Thanks for your informative post
Its really great work
Thanks for staring this information. It is really helpful for us sir.
Some positive news and bitcoin will be rocking as was seen in the case of Steem dollar sometime ago
Thanks for continually sharing this.
I cannot help and read "Will do that after I am back in Switzerland." every time I scan the news. I thought you were already back? :-P
Thank you for information.
One more week or so of this correcting, then we should head on full steam toward 4 digits.