Posting Activity Report 31st Jan - 6th Feb
This report provides a snapshot of posting activity on the Steem Blockchain for the past 7 days.
- How many accounts are active?
- Who is posting?

Image Source: pixabay.com
Focusing on the numbers/frequency of posts (i.e. ignoring payouts) we can get a feel for who is posting as well as the level of account activity.
In the first half of the report we analyse daily posting activity in detail. For the second half we take a weekly view.
We separately analyse the frequency of posting activity by:
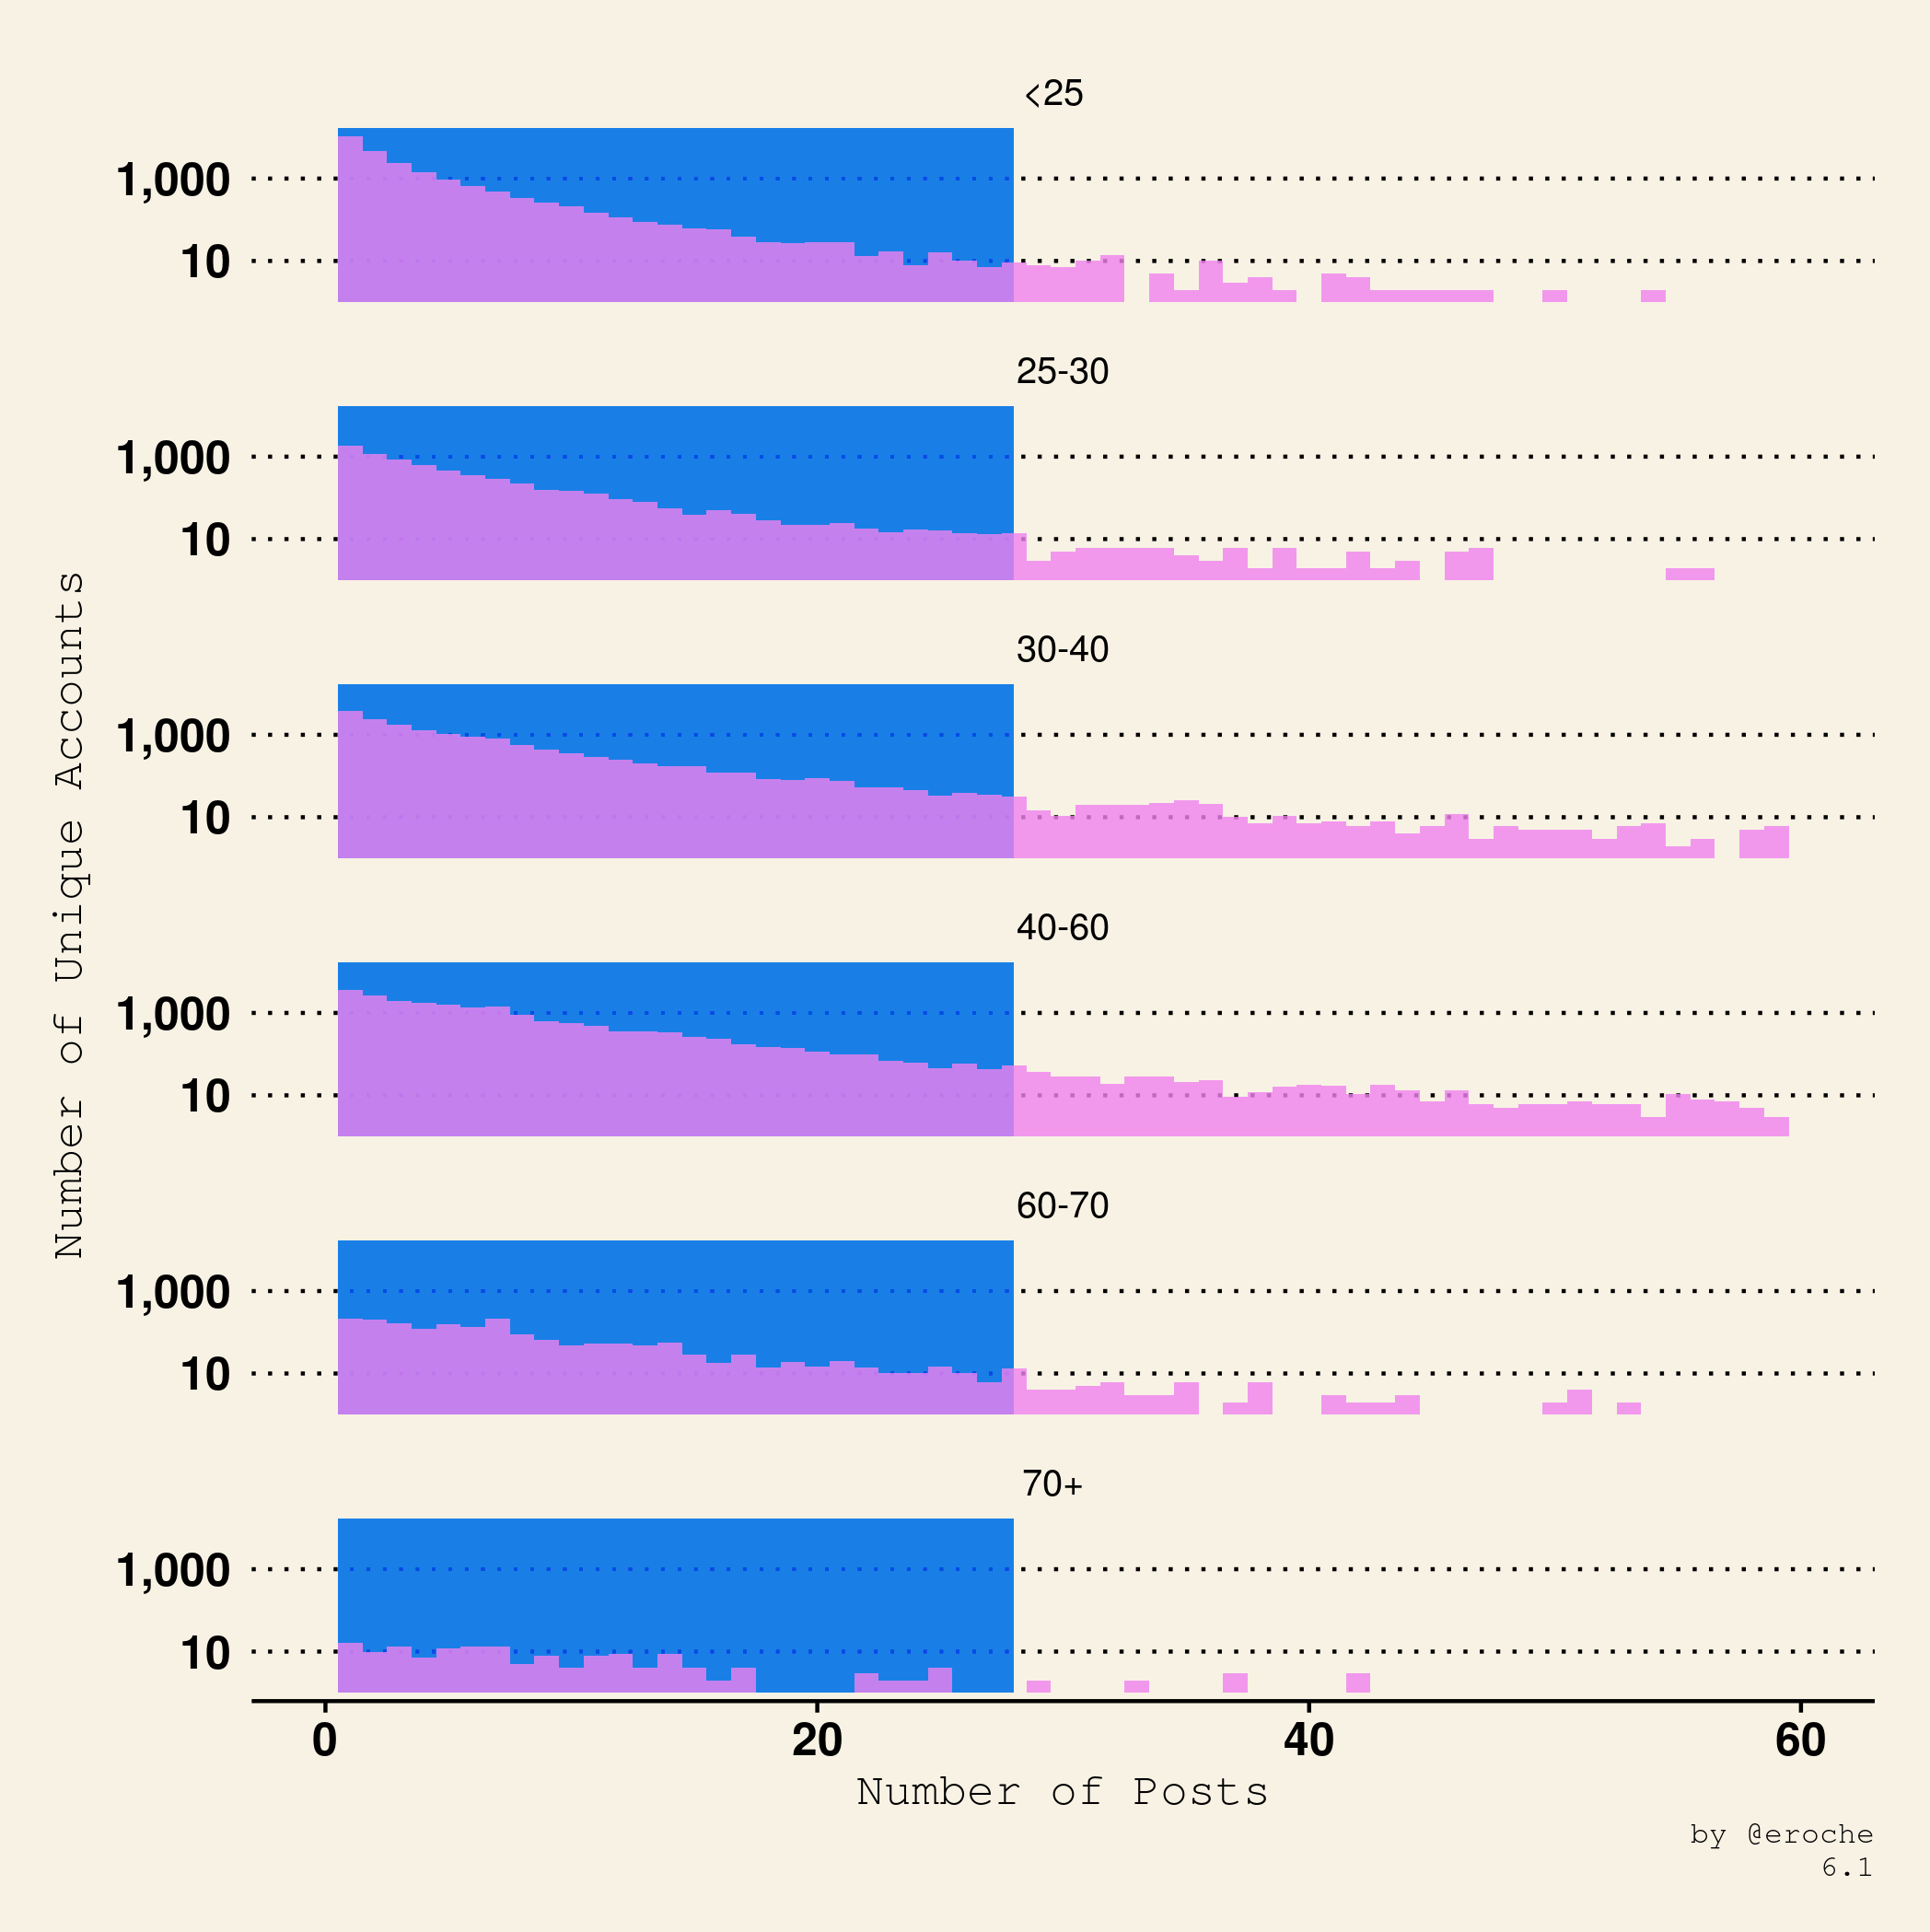
- Reputation of Author
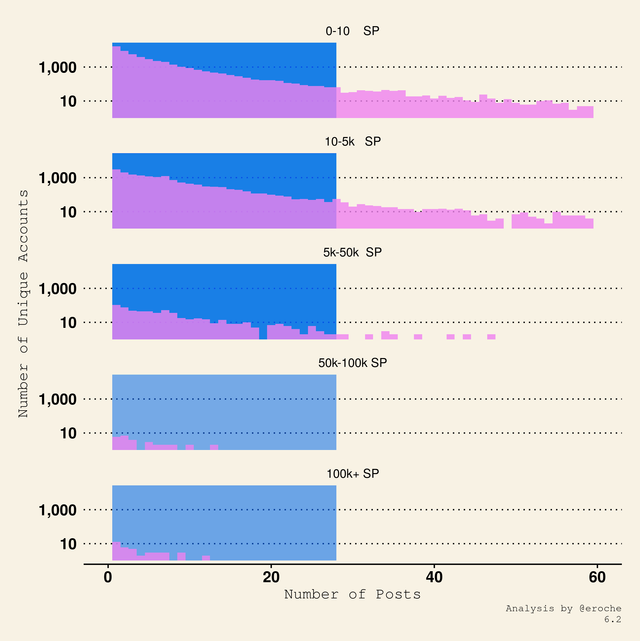
- Steem Power
- Date of Joining
- Automated vs Manual Posts
This Automated/Manual categorisation is based on frequency of posting activity over the last 7 days
The data for this report is sourced from https://steemdata.com/ by @furion

Posts per Day (ex comments)
In the past 7 days there was a total of 371k posts from 68k unique accounts. That gives an average of 5.5 posts in the week for authors that were posting.
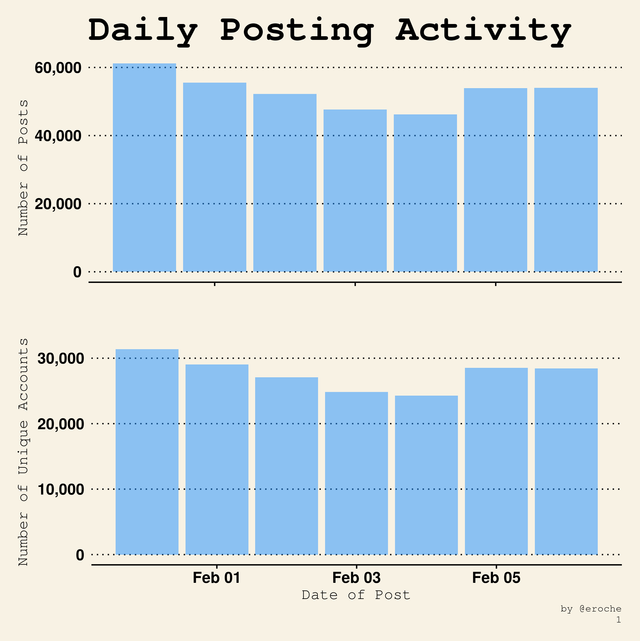
- The mean number of Posts per day was 53k
- The mean number of Accounts posting per day was 28k
Daily counts give a high level overview but we can examine subdivisions or groups of authors to get further insights into who is posting.
The colour in the following graphs represent different cohorts of Steemit Accounts.
Reputation
It can take a while to build your reputation and the system is designed so that it is easy to lose it. You don't want to get downvotes from people with higher Rep!
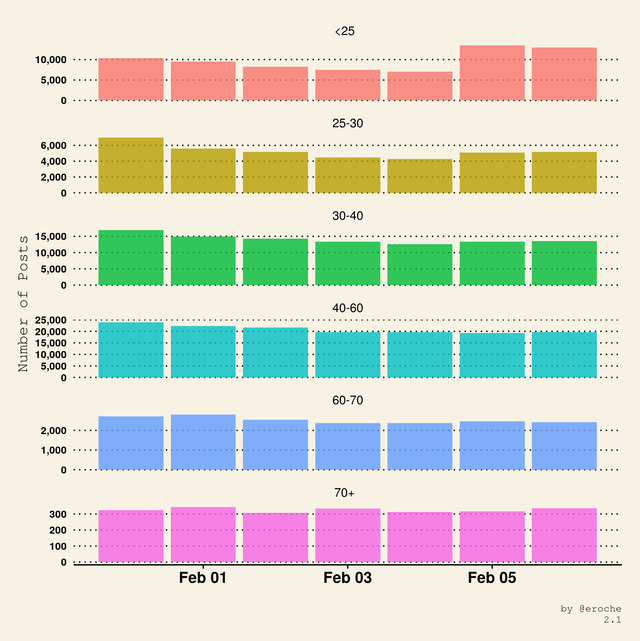
The next few graphs examine how many posts per day are made by people of different Reputations.
Total
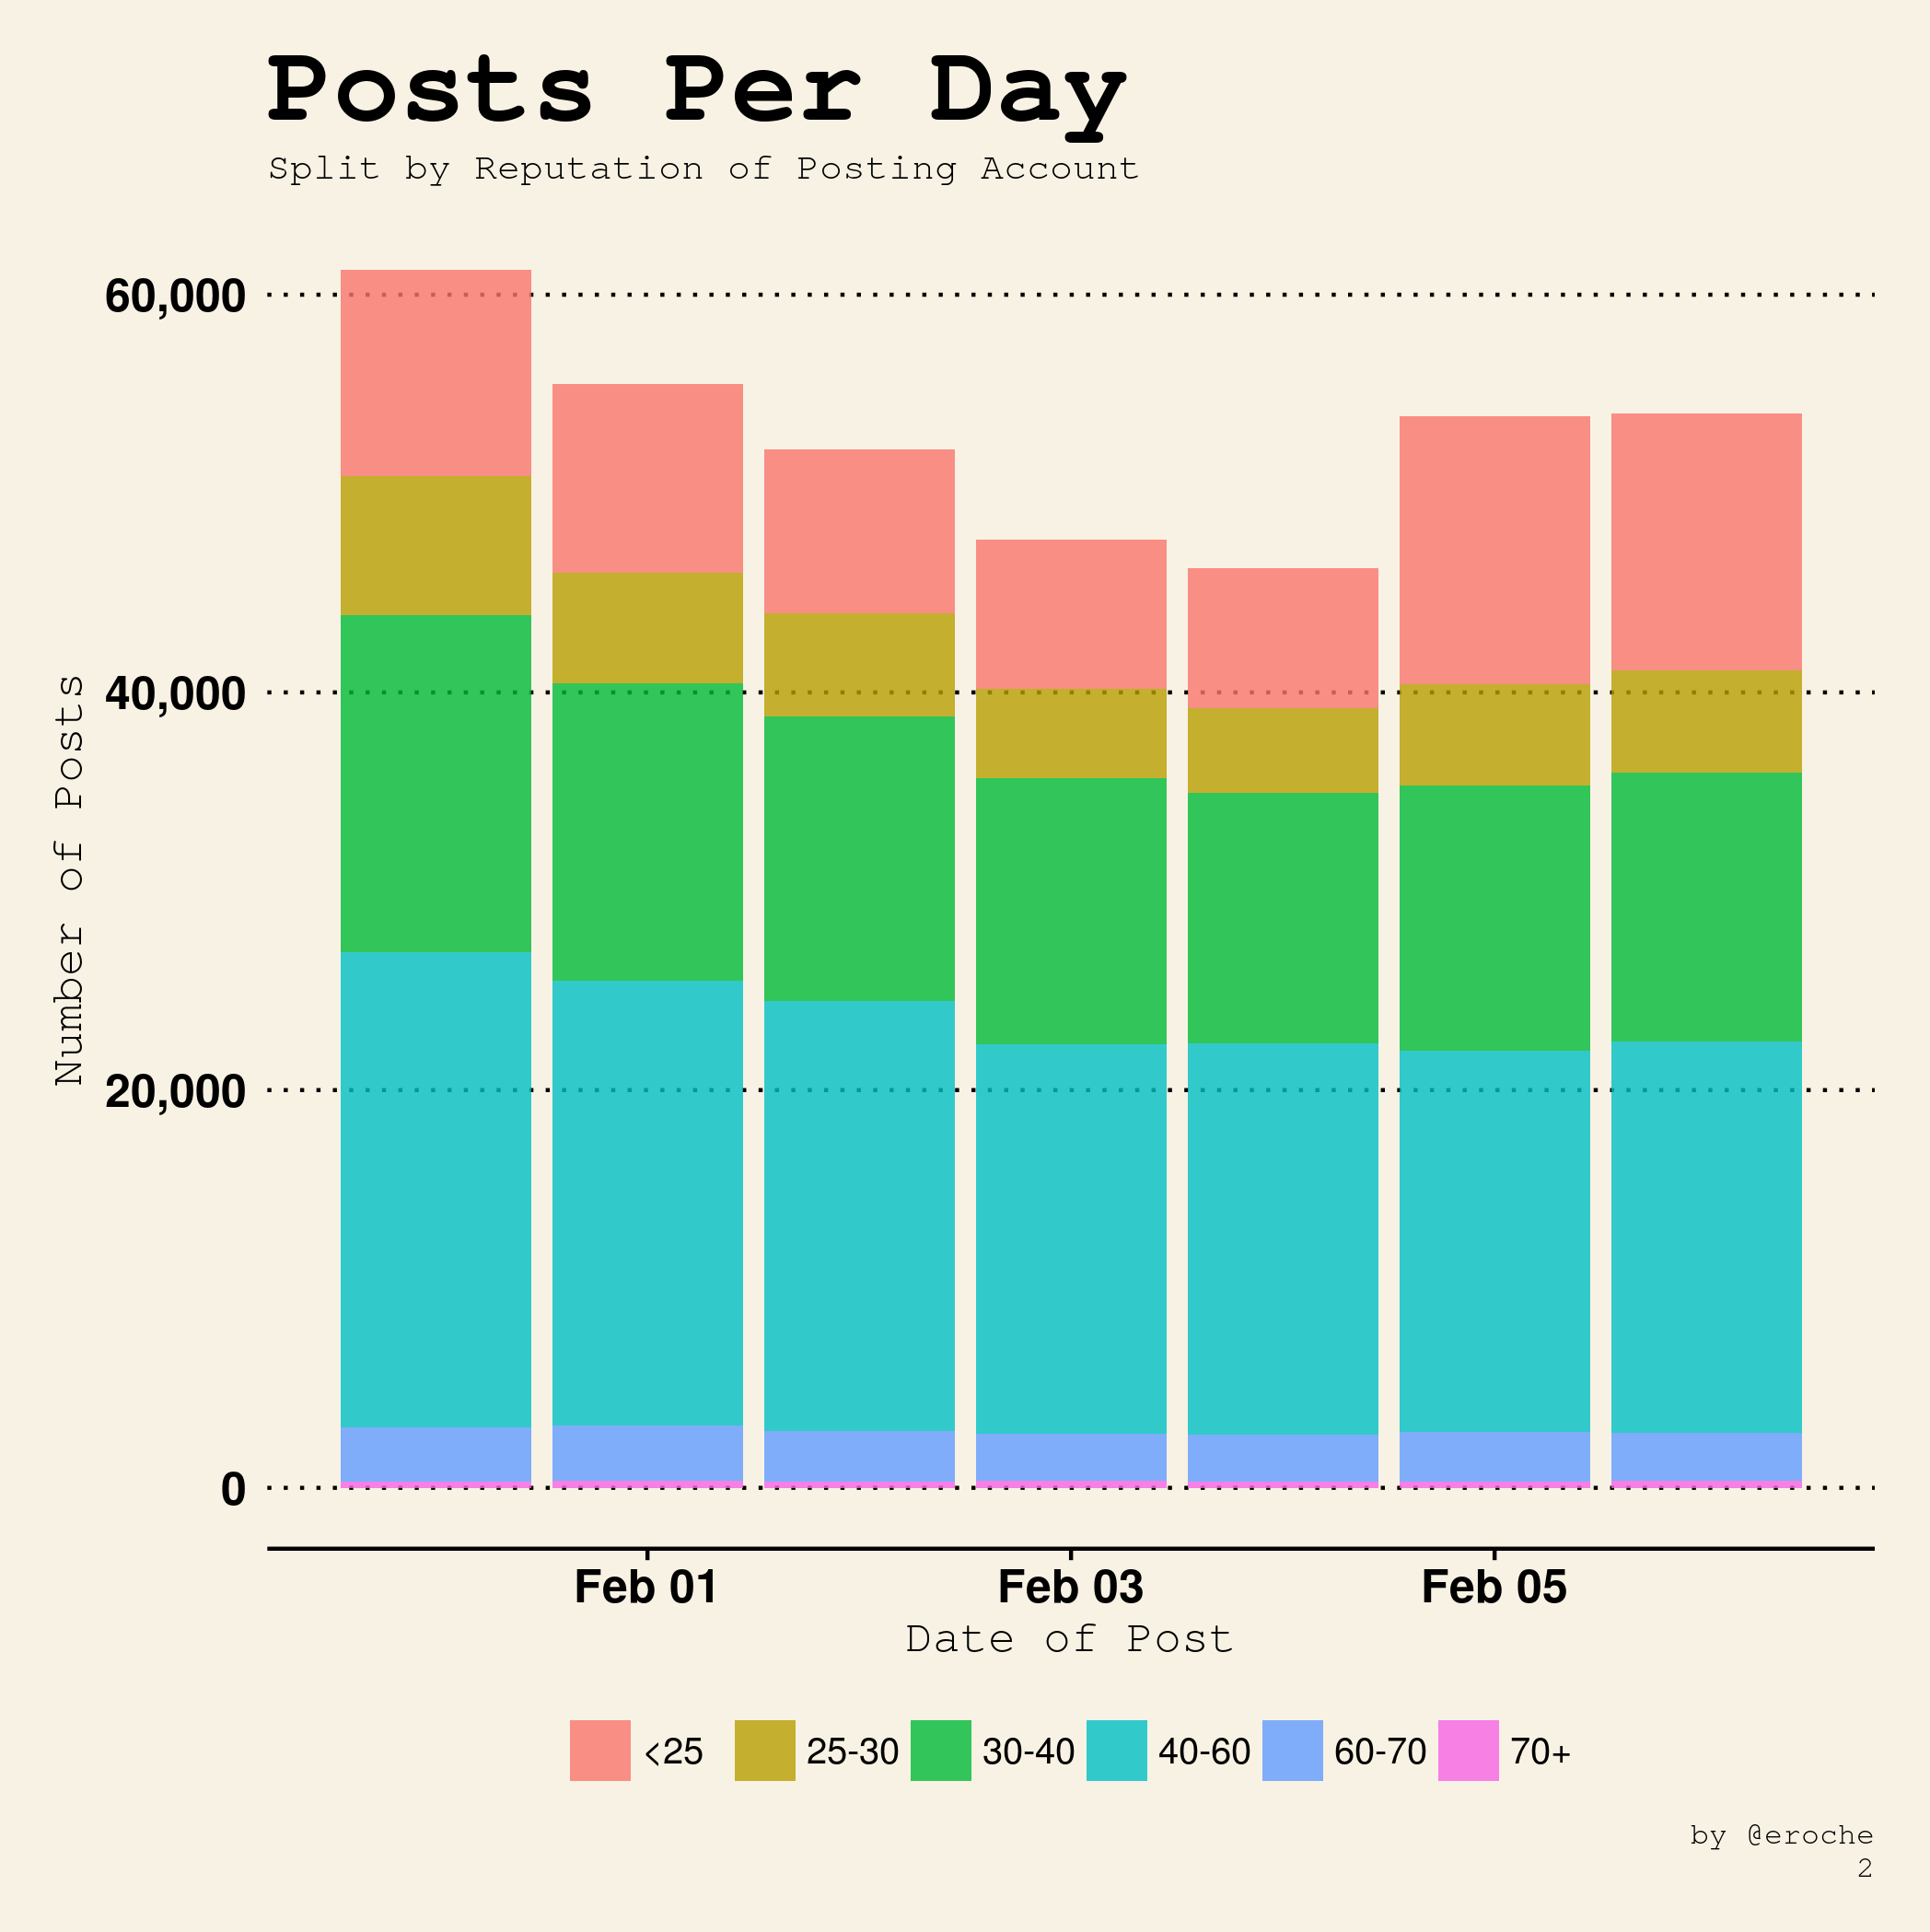
Breakdown
Steem Power
Steem is a stake weighted platform. If you have more stake your vote is worth more.
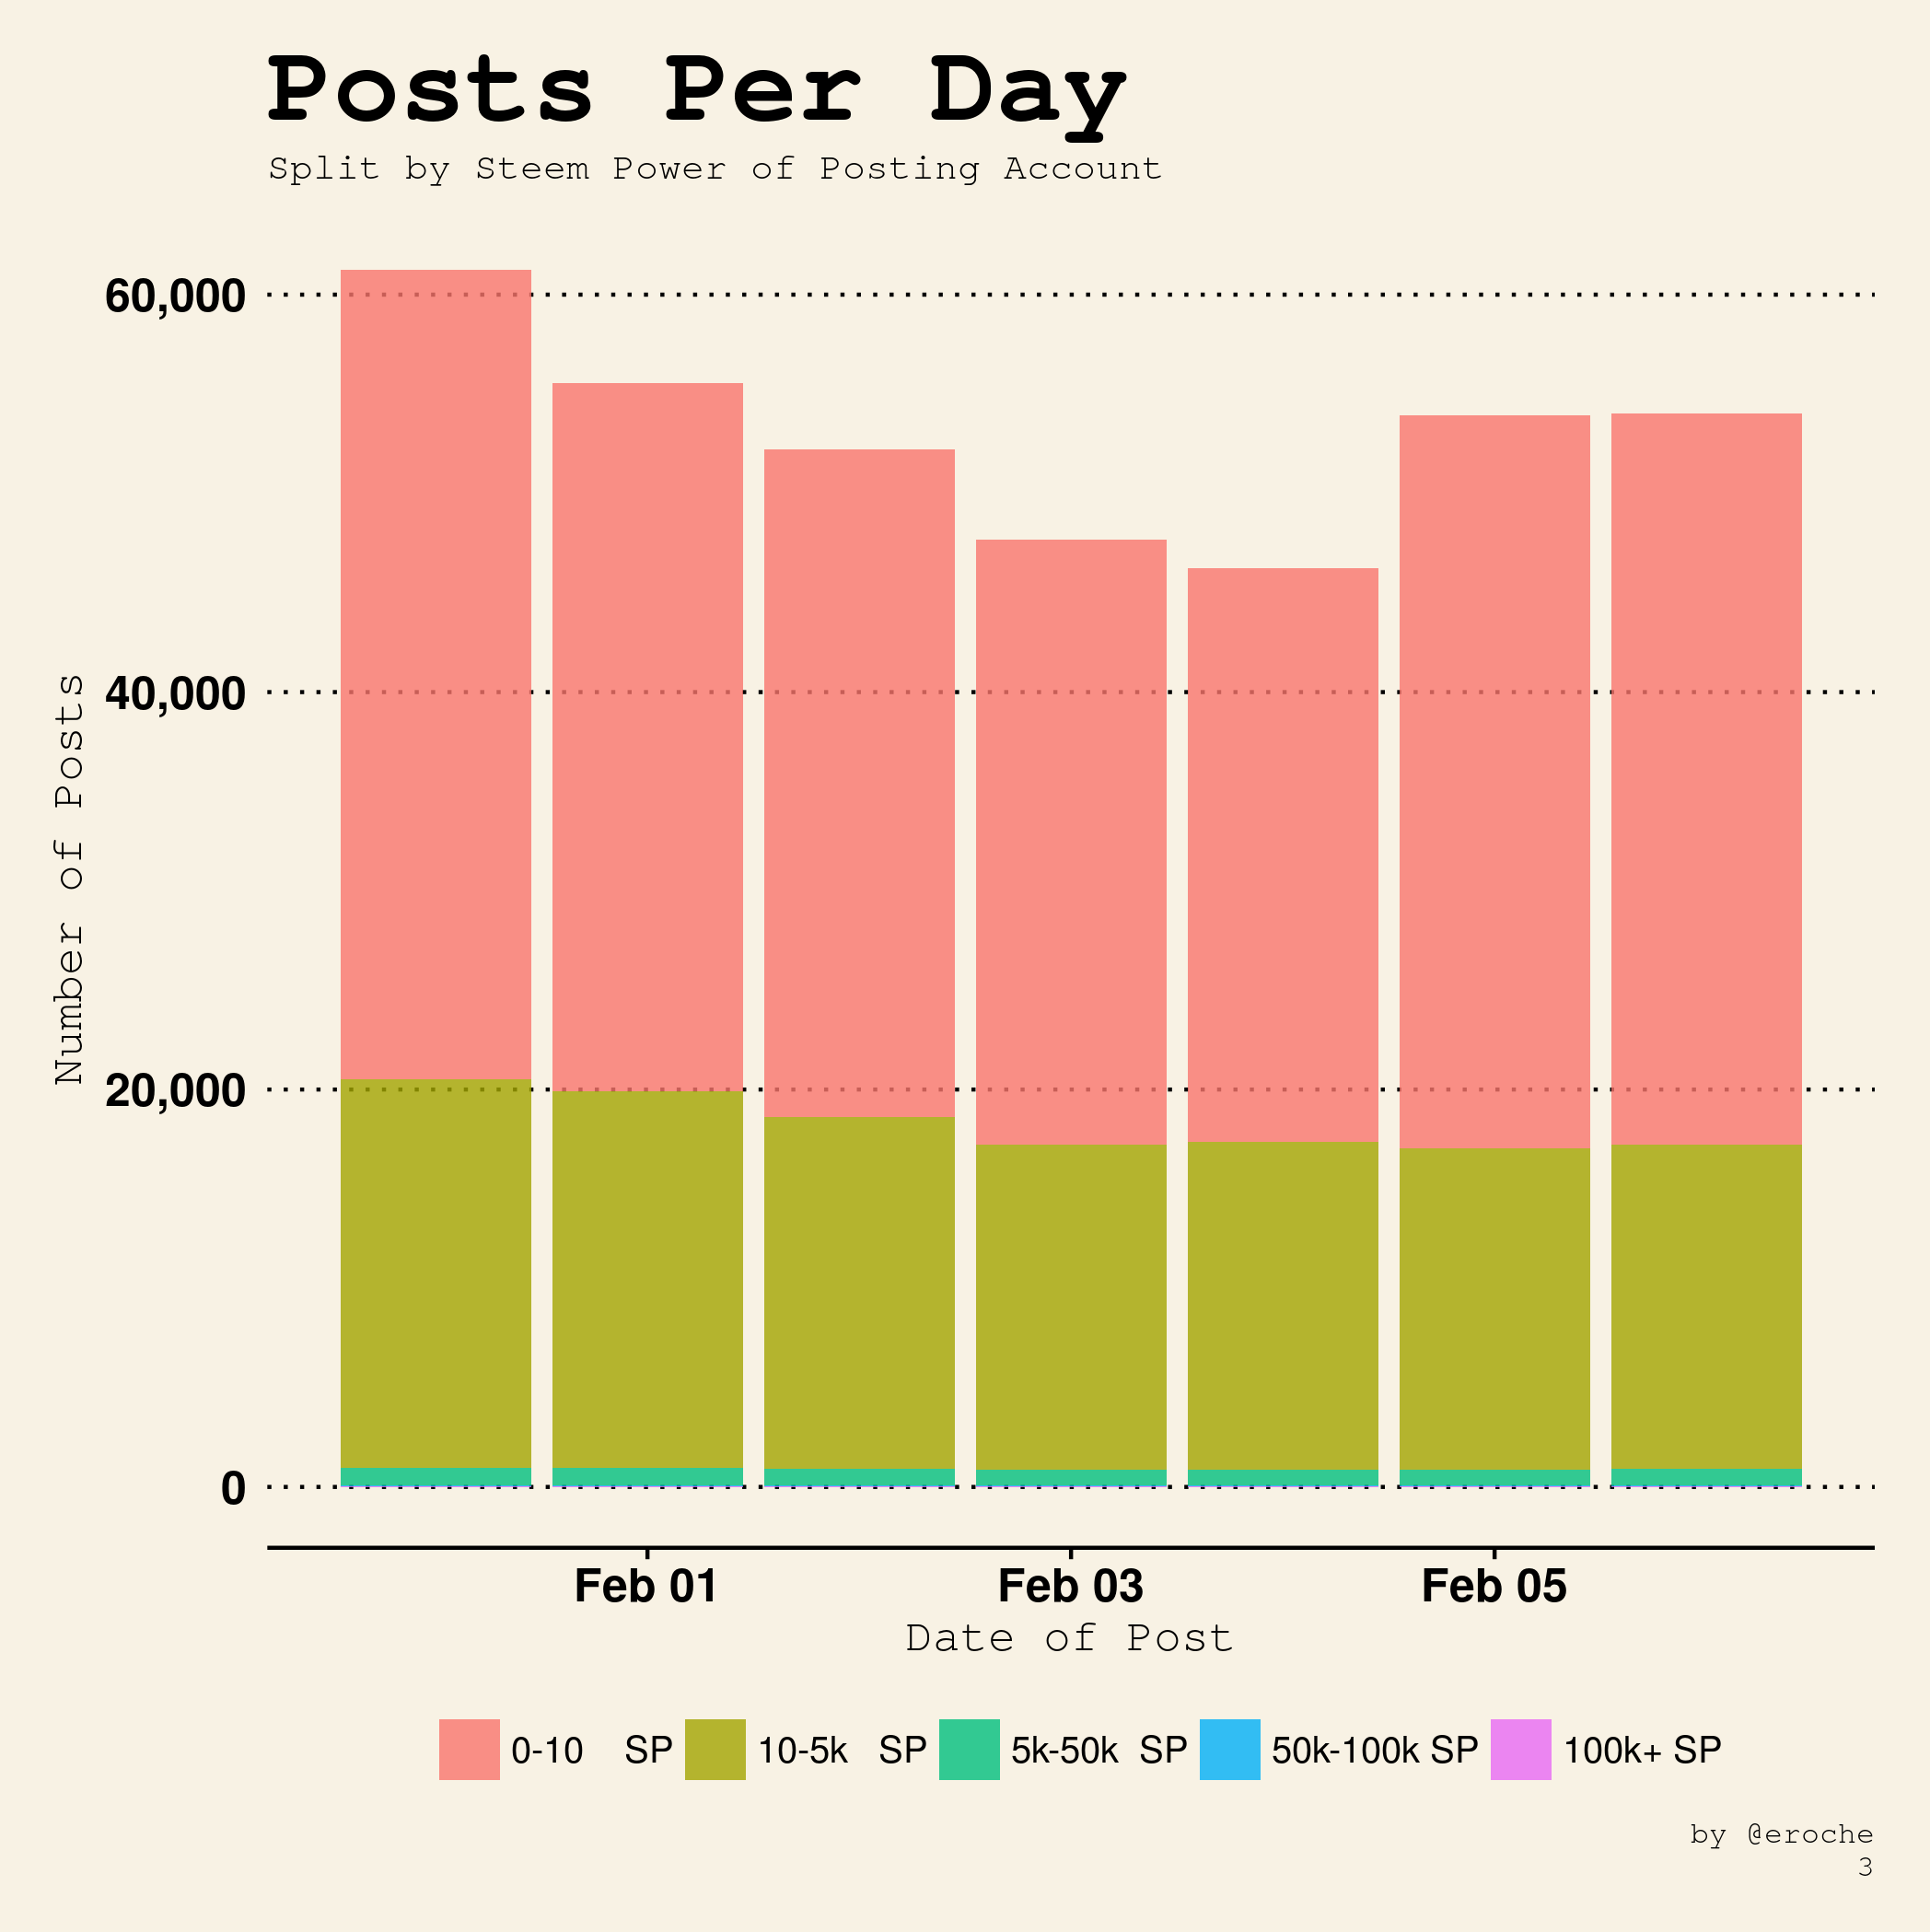
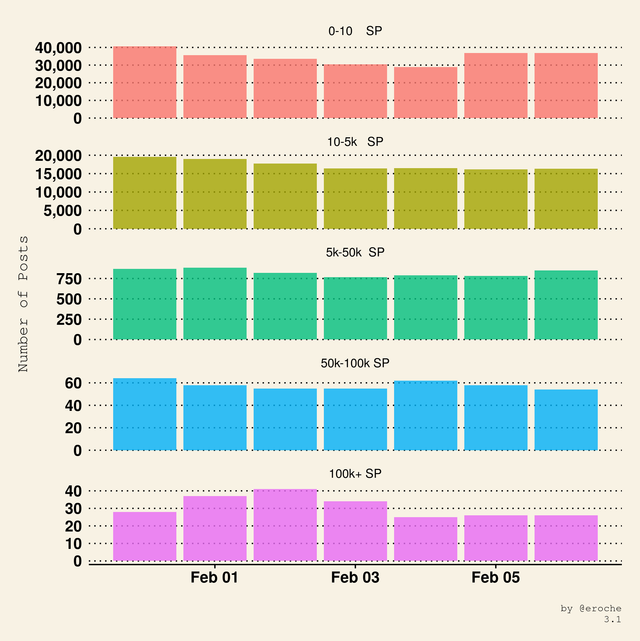
The next few graphs examine how many posts per day are made by people with different levels of Steem Power.
Total
Breakdown
Account Duration
The first accounts were created in April 2016. We are now passing the 700k account mark. Absolute number is important but retention is also important.
- How many people who joined over the course of the last year are still posting?
- Who is creating the bulk of the daily content?
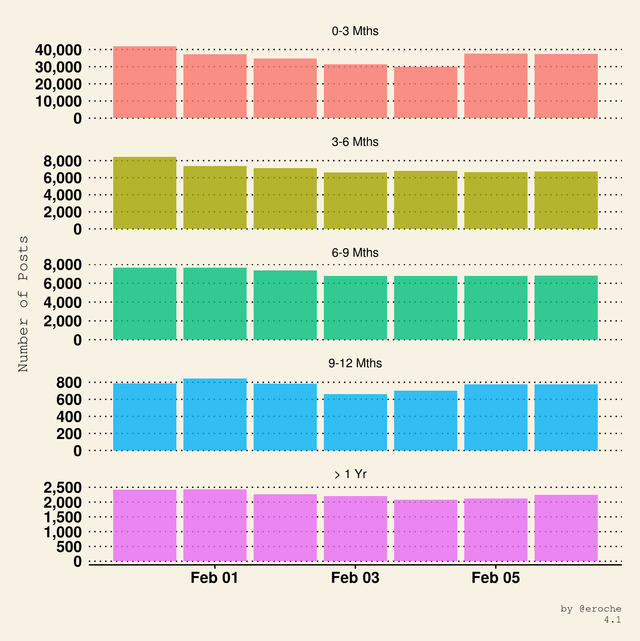
The next few graphs examine how many posts per day are made by people that have been on Steemit for different lengths of time.
Total
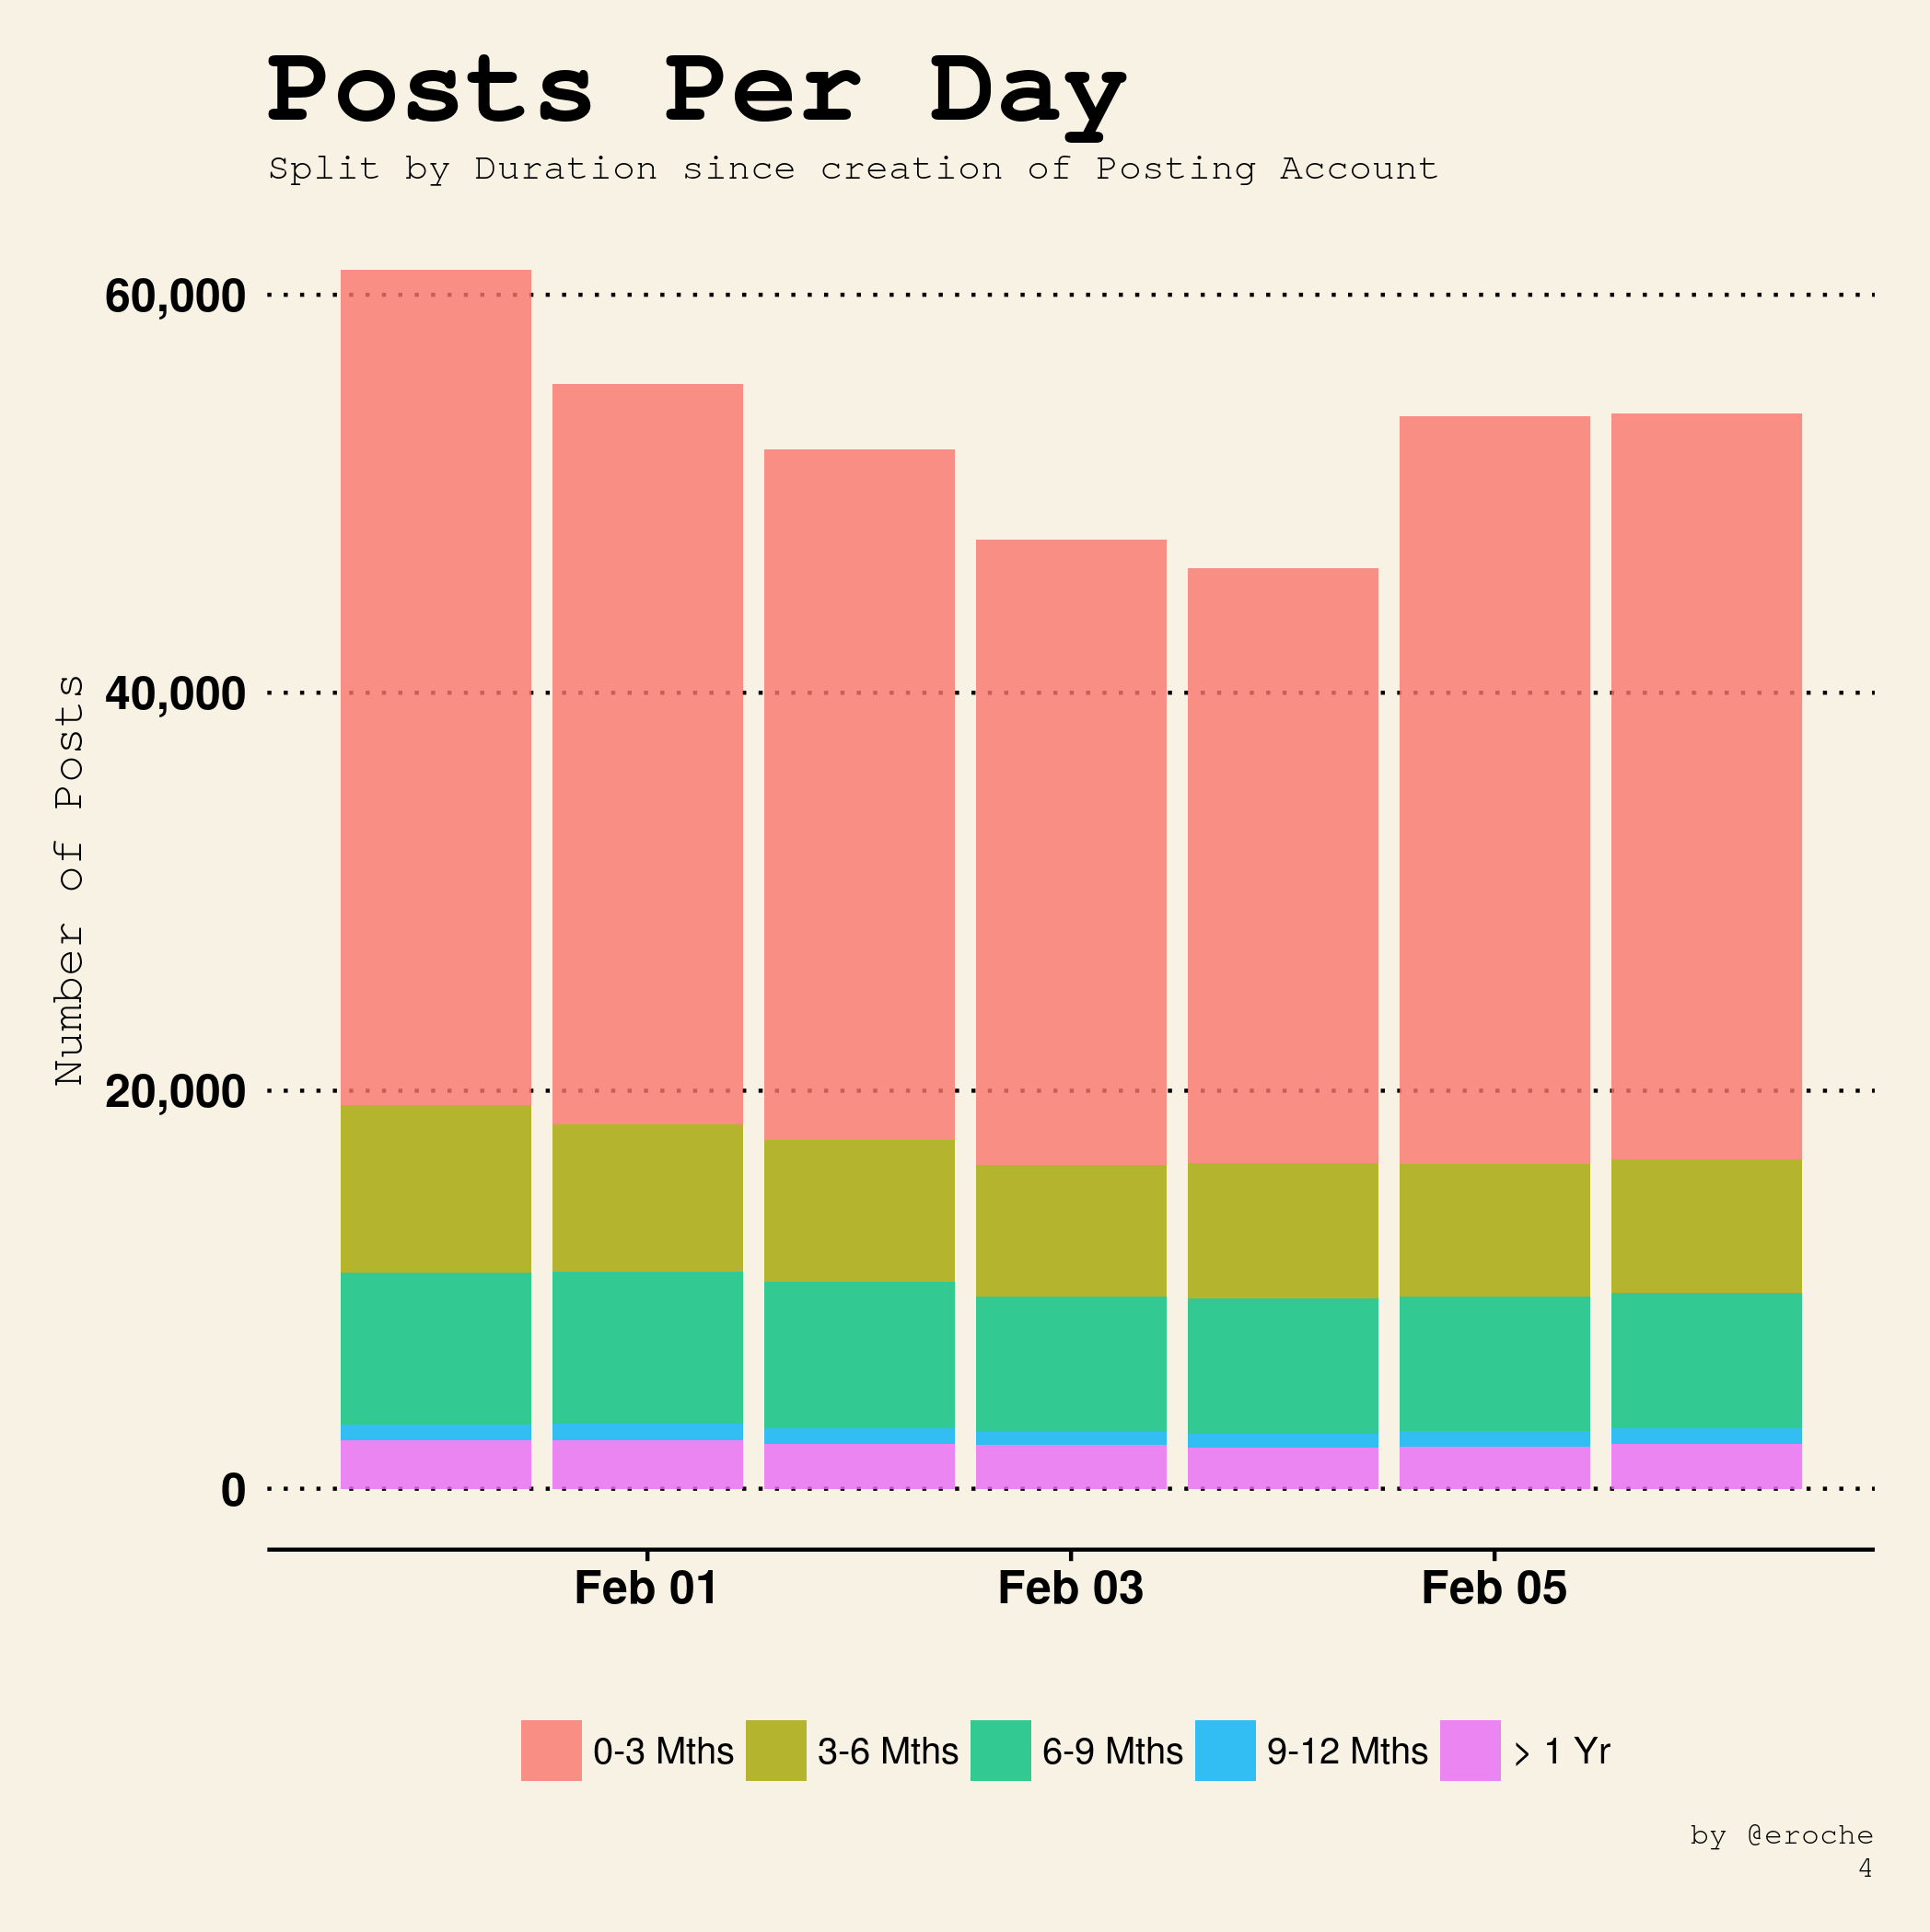
Breakdown
Automated Accounts
If there is one, what is the number of comments a day that we could use to identify automated accounts?
I would propose anything higher than 4 posts per day (on average) uses some sort of automation. This number may not be correct but it's a starting point for our analysis.
Automated accounts may post daily reports or in some cases may just be people spamming the system with low quality content or content copied from other sources. Not all automated posts are bad and some provide a useful function such as daily statistics, market analysis etc. Splitting out these automated accounts will be more relevant for comment activity however it's also worth tracking for posts.
The next few graphs examine the daily posts that are in some way automated.
Total
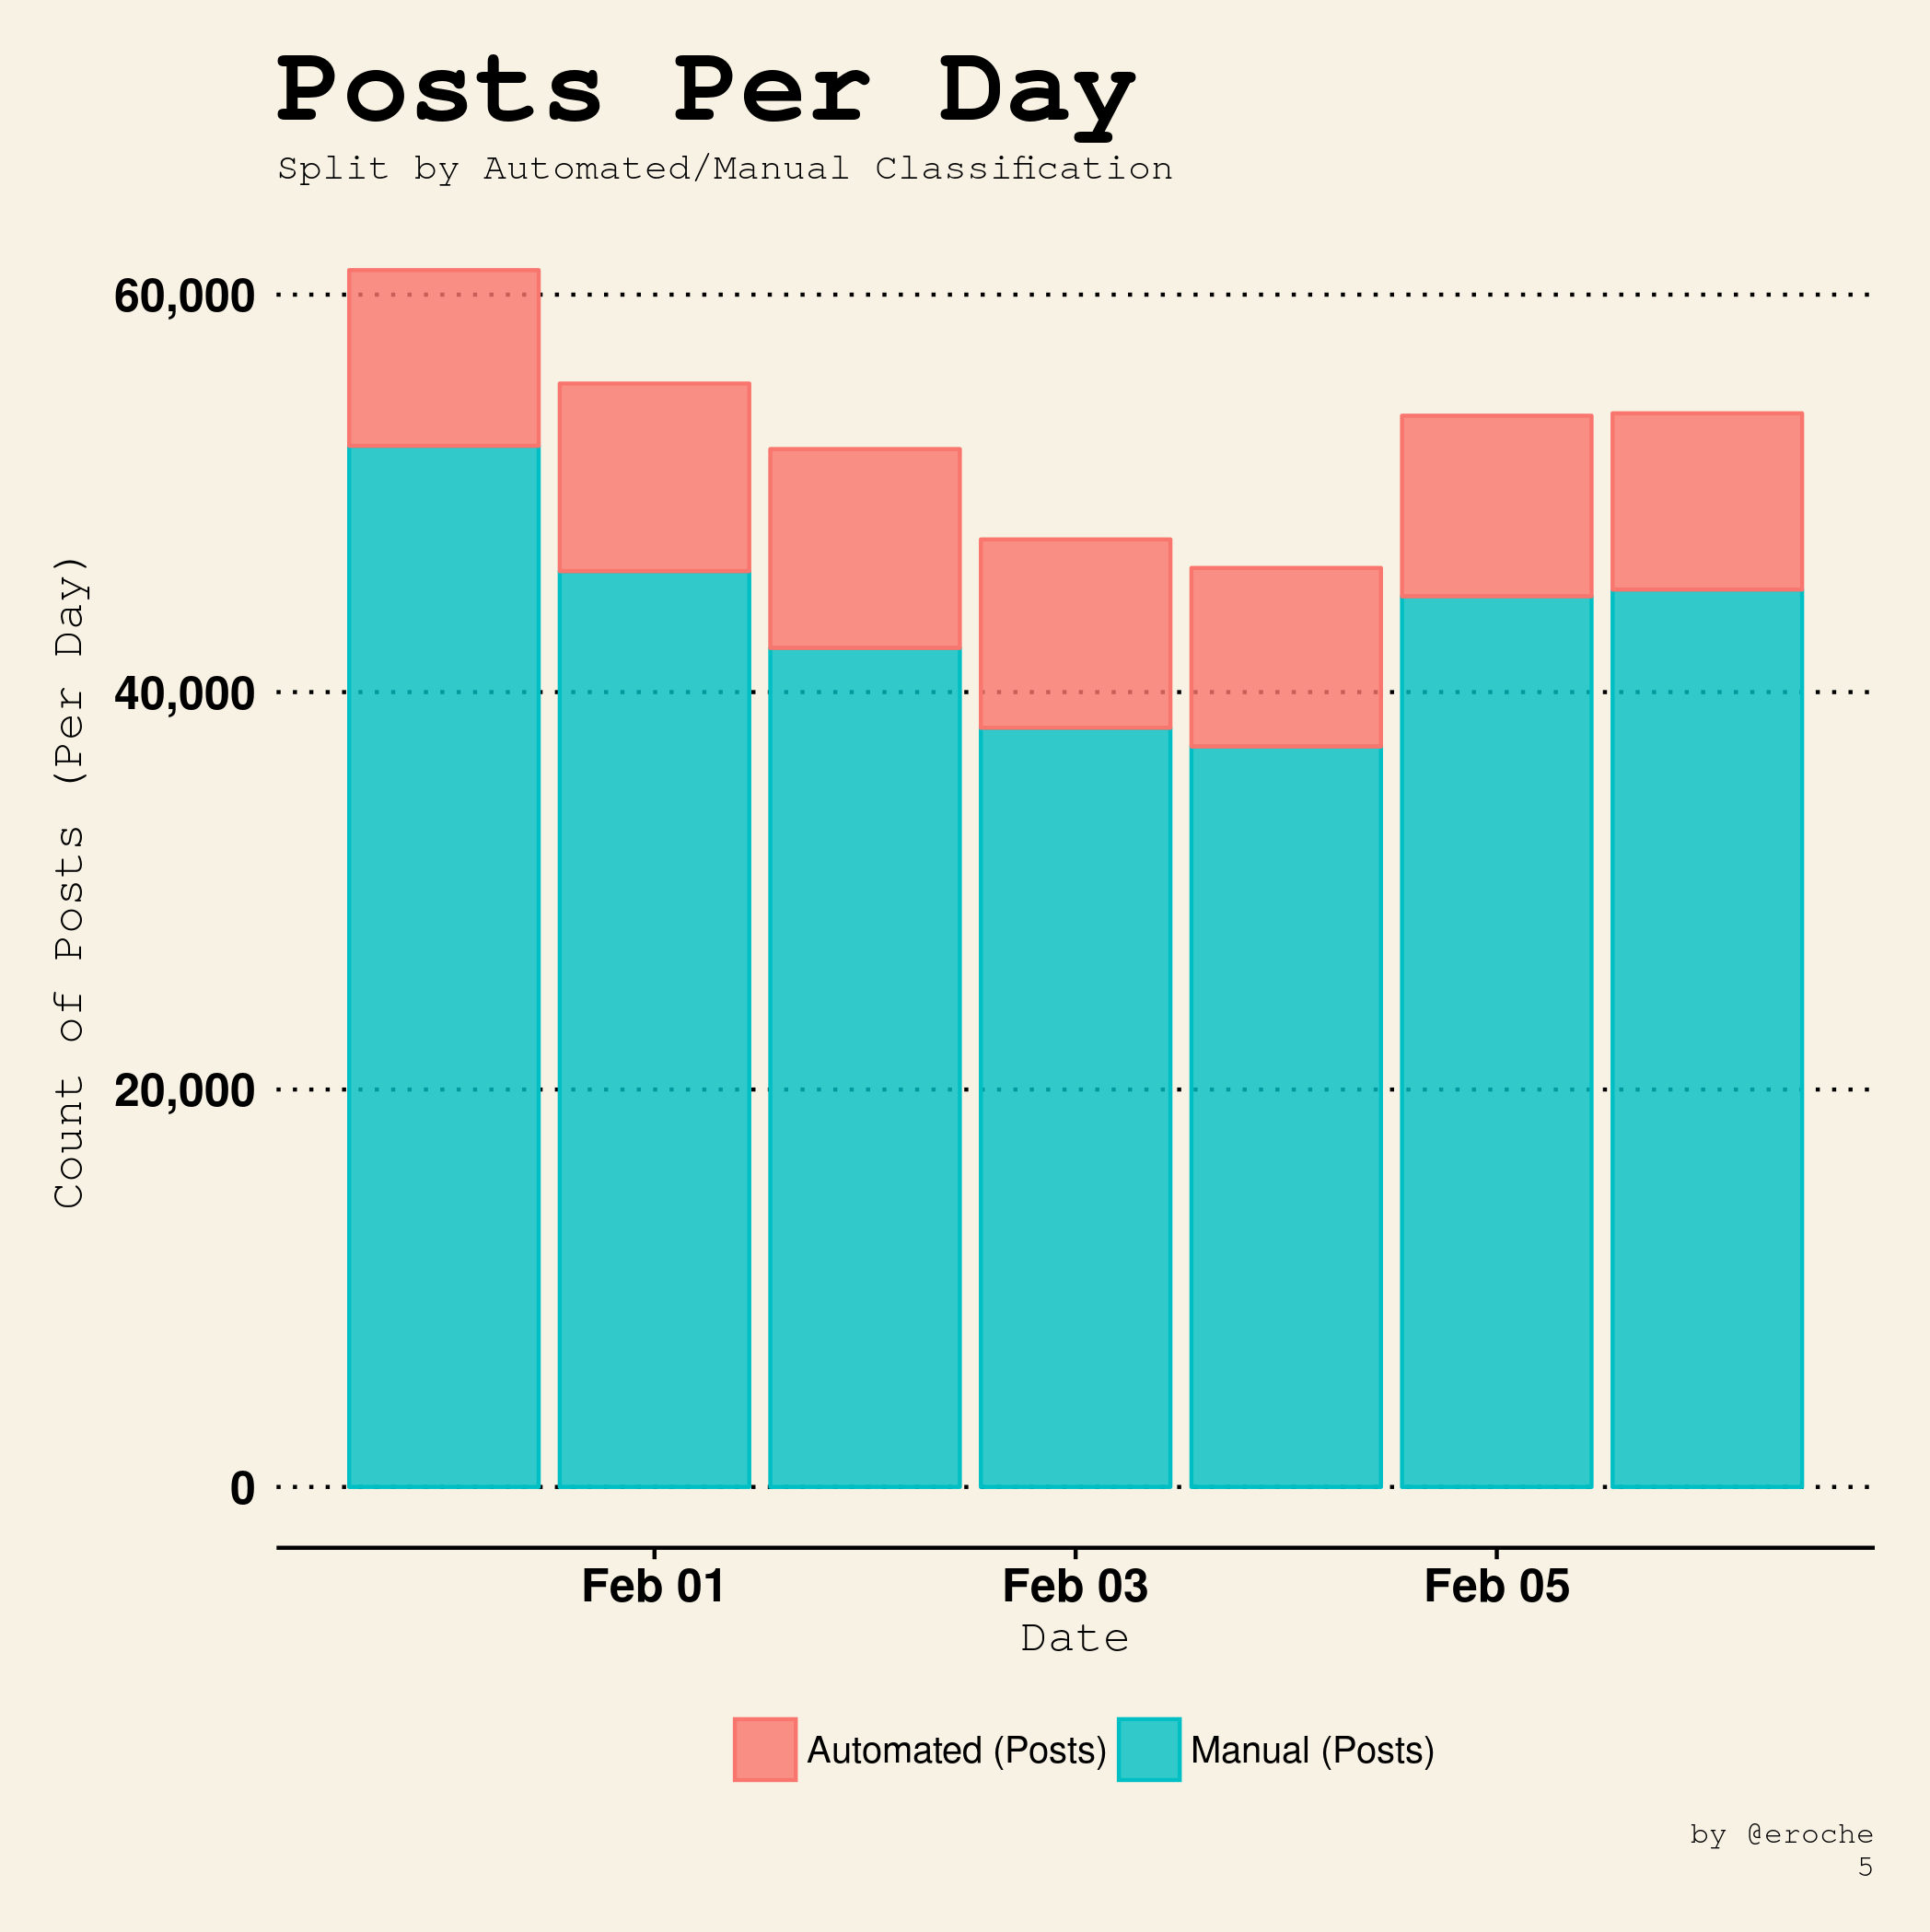
Breakdown
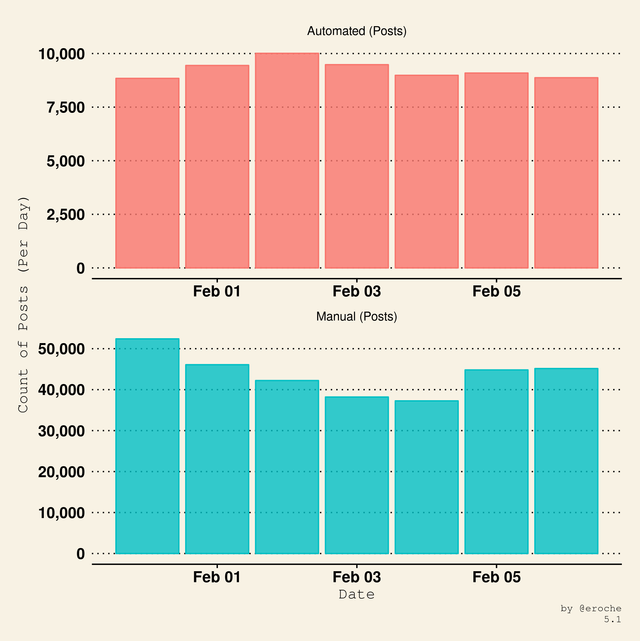

It is useful to look at numbers of posts on a daily basis but aggregating over a longer period gives us additional insights.
Posts per Week
The remaining graphs examine the posting activity over the last 7 days in aggregate.
Posting Frequency
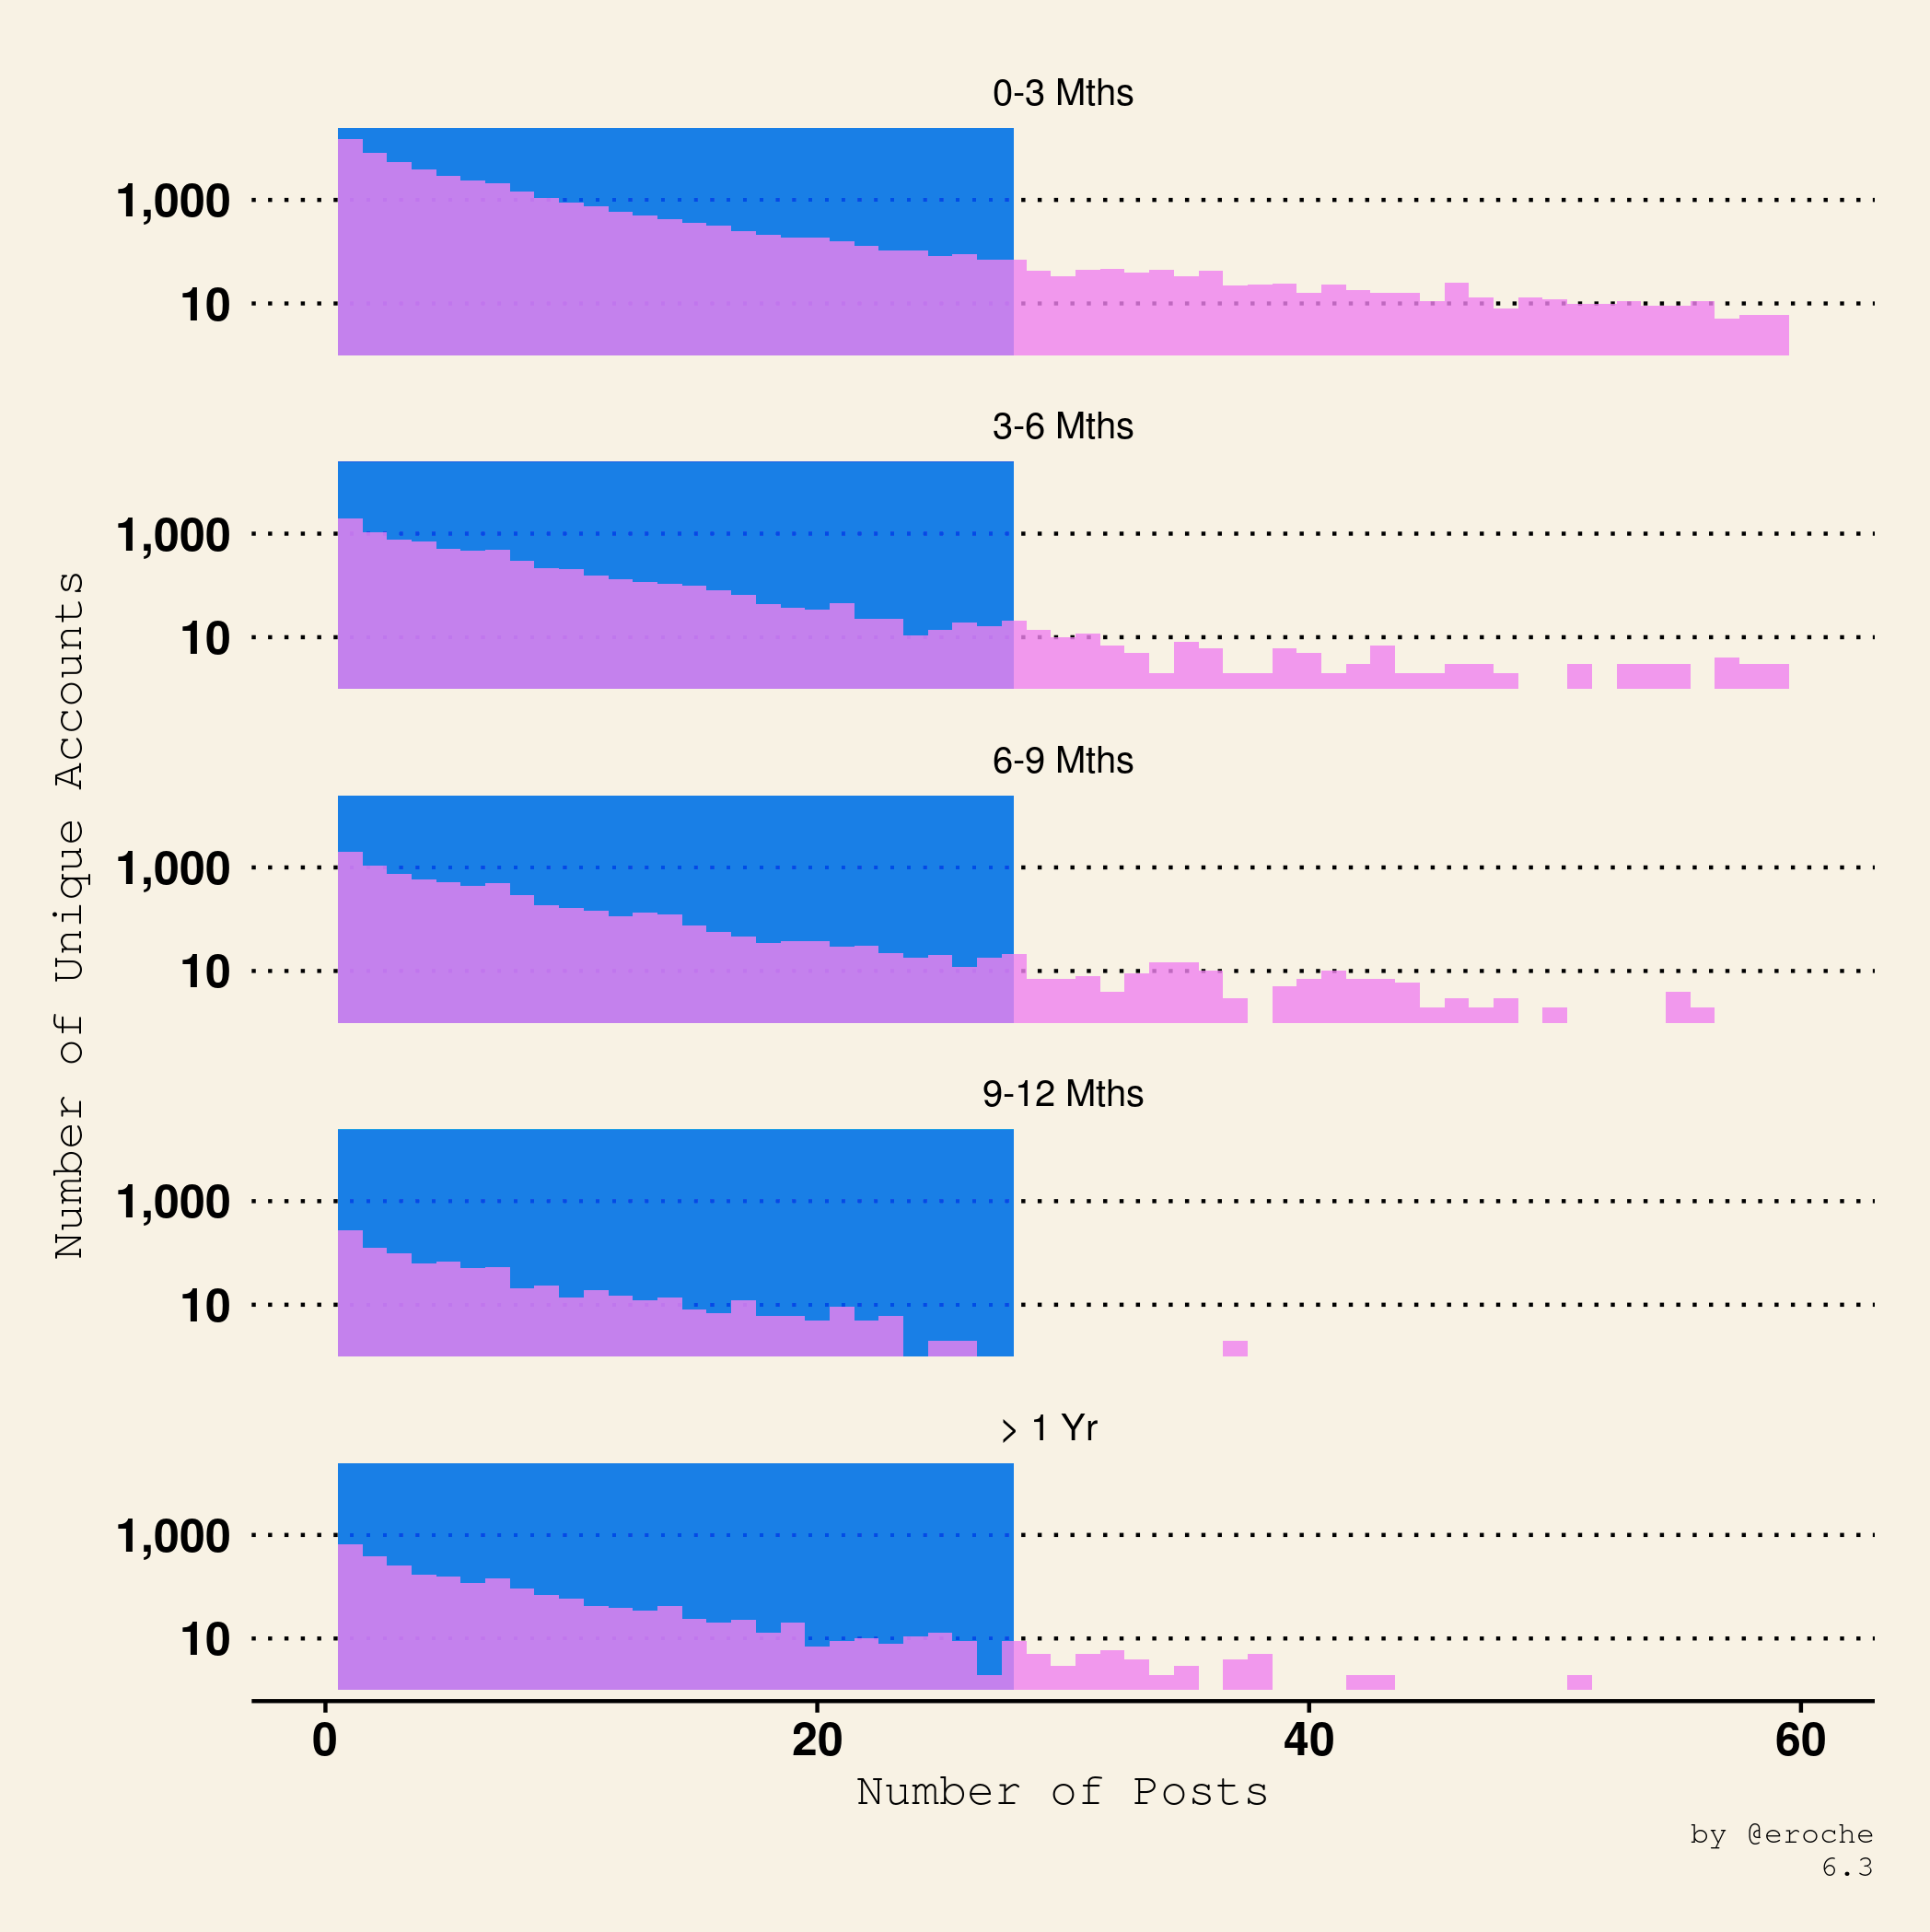
The number of posts for individual accounts plotted versus the number of unique accounts shows how frequently accounts are posting.
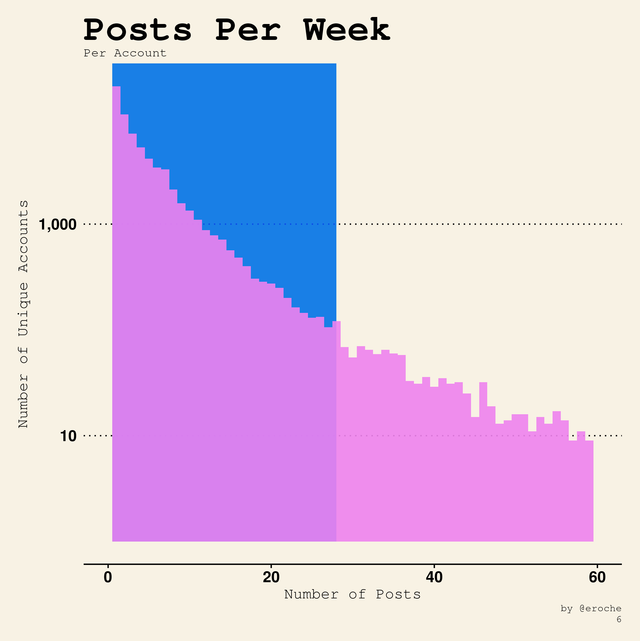
- The blue shaded area represents less than 4 posts per day (on average).
- A large number of accounts post less than 4 posts per day.
Let's examine the breakdown of this frequency by the categories we have looked at before.
Reputation
Steem Power
Duration

Related Content
If your looking for more daily statistics:
- @arcange produces daily reports with really useful data.
- steemdata.com, a website by @furion, has live interactive charts
- #blockchainbi and the members of the @Steemitbc community, spearheaded by @paulag, produce detailed analysis on all things related to Steemit.
This Posting Activity Report will be published on a weekly basis going forward as well as further analysis that takes a look at Post Payout Activity. I will also provide longer term trend analysis in a similar format on a less regular basis.
- What area of this report did you find most useful?
I would love any feedback to improve or clarify any of this analysis.
Thank you for reading this. I write on Steemit about Blockchain, Cryptocurrency, Travel and lots of random topics.

Hi @eroche,
Wow, reading your post was very insightful!
If I got it right, Steem users with very high reputation and very high steem power are not really producing a lot of content. Is this because the absolute number of this group of people is quite low?
What I also found very interesting: The probability to keep being active after one year seems to be very very low!
I would be very curious how all the new users are changing the dynamic on Steemit.
Please keep posting those interesting statistics!
Cu,
Chris aka smallstepschange
Thank you so much for your comments.
You got it right in terms of volume but it's worth noting some of the content that the high steem power/rep users produce is very high quality. I find it interesting to monitor this group as a type of health check on steemit.
The number of people active after one year is low but there has been a rapid growth in users in recent months. It would be interesting to look at this I as a percentage of users that are on the platform at each stage. From now on I think it will be more and more important to monitor retention and activity levels.
You are right. High reputation users might be focusing on quality rather than on quantity.
Following a group of people (maybe a randomly selected sample) over time would be highly interesting.
Also I guess that the characteristics of the new users (e.g. personality) might be somewhat different when compared to the older users. It would be very interesting to know their motvation for joining and how they initially heard about Steemit.
Very interesting stuff!
CU
Thank you very much for looking into this. It gve me an idea of how much posts were automated. The thing that comes to mind is that these 'spam' accounts are limited by the bandwidth they have which is tied to the SP they have. If they want to post more, they have to gain more SP.
I think automated accounts will increase as people realise how good and cheap the Steem blockchain is. I wouldn't necessarily call them all "spam". I think there are some useful automated posts, but I agree there is a lot of Spam in this bucket. Interesting observation though they are not all bot accounts, some are just people copying and pasting from other sites. I will do a version of this report for comments at a later stage where we will see a lot more automated activity.
I agree. I just made a generalization.
Interesting indeed. It still takes effort to copy and paste those content. So there's still a human behind those content, just not that 'disciplined' yet.
It seems that newer smaller accounts posting habits correlated with the crash and then slight recovery of the Steem price.
Also you should probably revisit the groupings for the Steem power chart. Two of the group's don't even seem visible on the chart they're that small. I'd combine the top 3 and probably split the 10-5k group
Otherwise great stuff as usual.
Good points
I think what I need is more groups at the lower range. It may be worth dividing this chart into several pieces. I don't want to lose the splits for whales as I think these are interesting stats to bring out on a weekly basis.
Thanks for your comment.
Yeah but you can't really break up the 0-10 sp group. It's just a reality that this already relatively small sp range makes up a good chunk of users and activity. I think that basically paints the picture that it needs to.
You'll never ever get to see such numbers from a centralized entity such as Facebook or Google. They'll keep saying we've hit the billion users mark, but only they'll know if they hit that number or not.
This platform is far better.
That's a great point.
Nice post brothers..
Thanks @fauzi86
Thanks for sharing great post
@eroche
very good post friends
Nice, pleases flbck and vote me
Rule 1 dont beg for upvotes and follow backs this isnt instagram man
Thx for the stats @eroche. I do hope steemit doesn't turn into what looks like some sort of ponzi scheme where the activity of the little guys maintain the large established players at the top! And those that drop off at the bottom just get replaced by new hopeful recruits until they in turn loose heart and fall off etc etc. Nice stats to view the inner workings of the platform.
I hope it doesn't turn out like that.
If it does it may be just a microcosm that just reflects society at large ...
Beautiful explanation, graphs very colorful and easy on eyes as usual. Technical stuff presented in a cool pattern. Indeed, almost everything regarding posting has been covered, nicely. Look forward to further analysis, regularly. :)
Thanks so much.