Understanding & Building the Point and Figure Charting
Hello everyone, How are you doing, I welcome you again to my blog in the Steem Alliance community.
Today, we will discuss an interesting topic on the platform which will be: Understanding & Building the Point and Figure Charting
- Introduction
Point and Figure also referred to as (P&F) charting is a simple and direct strategy for technical analysis that identifies the price development of an asset in a specific timeframe, this strategy can help traders spot a new price action and also a potential reversal in the market.
Therefore, in this article, we shall discuss the simple overview of Point and Figure chart structure, trend analysis, and trading strategies using the P&F charts.
Getting Started with point and Figure(PnF) Charts
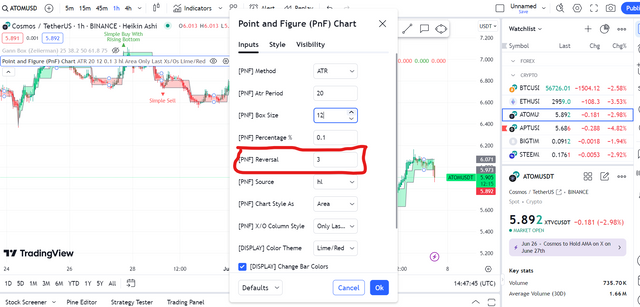
Select A Size Box of Your Choice: The price movement needed to mark an X or O on the chart is determined by the box size, For example, assuming that the crate size is set to $12, a X is plotted for each $12 increment, and an O is plotted for each $12 decline.

Selects A Reversal Price: The price change that is required to switch from charting Xs to Os or the other way around is determined by the reversal price, usually, a three-box reversal is used, so we won't tamper with that, meaning a difference in three boxes is expected to change the indicator movement.
Using the Point and Figure Chart to Analyze MarketTrends
Identifying of Market Trends:
Uptrend: An uptrend is identified when we see a series of green boxes, and also, if the green boxes constantly keep printing higher highs, therefore the trend is confirmed to be a strong uptrend.
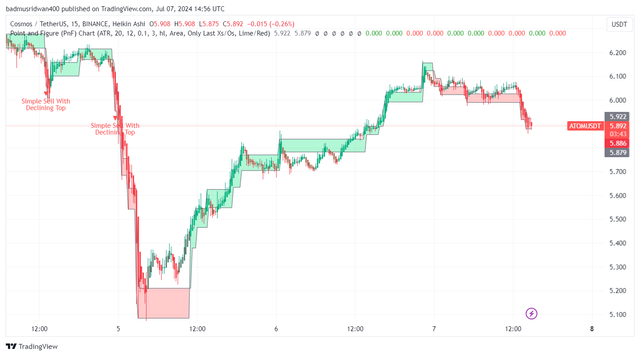
Downtrend: We can sense a downtrend signal when a series of falling red boxes which is a sign of a downtrend., If the red boxes constantly make lower lows, the trend is strong and might crash further.
Support and Resistance
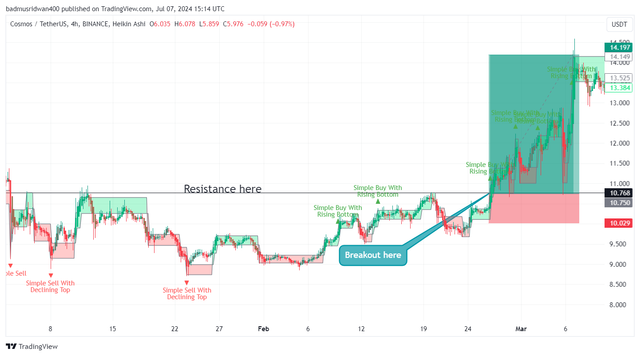
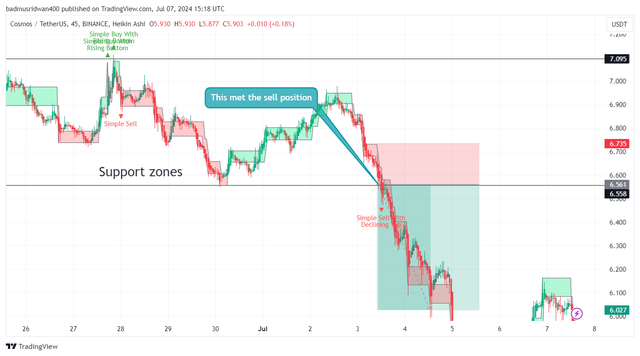
Support: We can also use this visibly to identify the support and resistance zone, the Support zones with strong buying volume are indicated by the box, formed by multiple O columns at the same level.
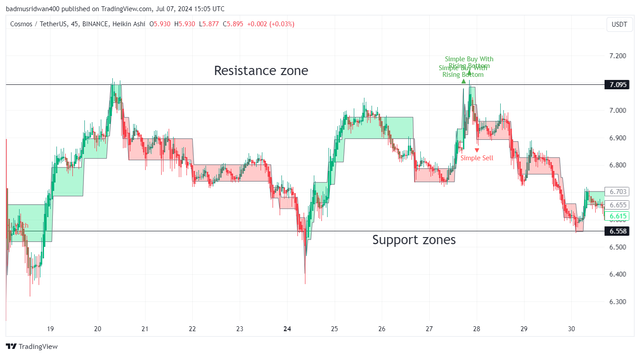
Resistance: These are the X lines shown by multiple X lines at the same level, which shows a resistance zone where it is solid to sell at that level.
Breakouts:
We can also use this charting method to visibly figure out a breakout pattern, and this mostly occurs when the price moves above previous levels of support or resistance, this is called a breakout, A potential buy breakout is seen when the price breaks above the box, while a sell breakout is when the price below the red box.
Point and Figure Chart Trading Strategies
Watch out for Trends:
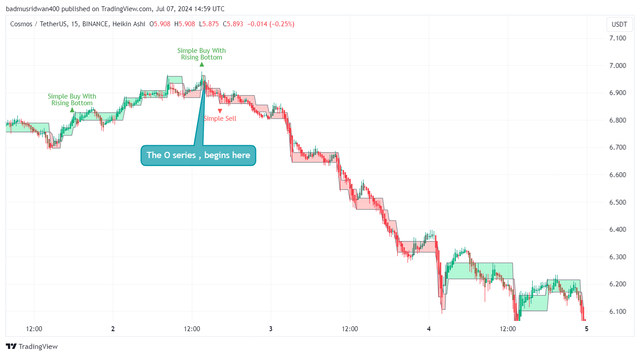
Buy Signals: The moment you see a new box of red breaks above a previous high (resistance), enter a long position. This suggests that an uptrend will continue.
Sell Signals: When You see a new Red box break below a previous low (support), enter a short position, this usually shows a continuation of a downtrend.
Conclusion
Market trends Are the utmost important identification for any trader, and this can easily be identified and analyzed in a clear and straightforward manner using point-and-figure charting, charting the Xs and Os, determining the right box size and reversal amount, and analyzing trends through patterns of support, resistance, and breakouts are all part of the process of creating P&F charts.
Using this trading pattern in the P&F analysis can help traders successfully catch patterns and likely reversals, and also help with improving their trading signals.
https://x.com/_bhardmorse/status/1809973105046990996
Upvoted! Thank you for supporting witness @jswit.
Note:- ✅
Regards,
@jueco
Thanks for the review ser