Steemit Crypto Academy Contest / S18W1: Mastering the Markets with technical analysis
Hello everyone! I hope you are all doing well and enjoying life with the blessings of Allah Almighty. I am happy to take part in the exciting challenge hosted by SteemitCryptoAcademy community . So, without any further delay, let's dive right in! Shall we ? ........, Okay , Okay😊! .
What is the importance of technical knowledge in trading? Describe the key components and information you can gather from a technical chart. |
|---|
Technical understanding is important to traders because it facilitates them to make well-informed decisions. Based on past data, traders can forecast future price changes by employing the field of technical analysis.
To find trends and patterns, this approach focuses on price charts and a variety of indicators. Gaining an advantage by being able to comprehend and read the these charts can help traders enter and exit deals at the appropriate periods.
Without technical know-how, trading can resemble gambling rather than a methodical approach.
Any professional trader's needs technical analysis and so tools for it. They are available in a variety of formats, including graphs with lines, bars, and candlestick charts, and they display fluctuations in prices over time.
Every kind of chart offers a unique set of insights. Candlestick charts, for instance, illustrate the sentiment about the market through the price action they display.
Comprehending these constituents facilitates traders' ability to discern patterns in the market and identify prospective avenues for financial gain.
- Information from Technical Charts
Technical charts provide traders with a plethora of information. They are qualified to recognize trends, which indicate the market's overall direction. For example, a rising trend denotes price increases and and a decreasing trend indicates falling prices. The price points at which the market tends to turn completely are known as support and resistance levels, and charts are frequently used to detect these levels. Traders can choose the greatest times to buy and sell by being aware of these levels.
- Patterns and Indicators
Indicators and patterns that indicate future market movements are also visible on technical charts. Trend reversals or continuations may be indicated by patterns such as head and shoulders, double tops, and flags. Further insights into marketplace circumstances are also provided by technical indicators such as Bollinger Bands, Relative Strength Index (RSI), and moving averages. By using these tools, traders may verify trends and forecast future movements in prices with more accuracy.
- Practical Application
Technical expertise involves more than just reading charts—it also involves using that understanding to execute trades in real time. Through the integration of indicators and chart patterns, traders may create strategies that align with their trading style and risk tolerance. Gaining proficiency in technical analysis can greatly improve your trading results, regardless of level of expertise.
It turns trading into a methodical, planned endeavor rather than a guessing game. Anyone may raise their chances of success in the market and enhance their technical trading skills with practice and ongoing education.
Explain how to read candlestick charts and the significance of different time frames in trading. |
|---|
Analyzing candlestick charts is similar to understanding the stock market's code. Every candle serves as a time capsule, or a moment in time, capturing the spirit of the market.
The wicks, which are thin lines, represent the highest and lowest prices reached, while the candle's body displays the price range between open and closure. Red candles indicate a decrease in price, whereas green or white candles indicate an increase in price.
Easy enough, huh? Various historical periods can be compared to distinct market lenses. Short-term (1–60 minute) charts provide a momentary picture of the state of the market.
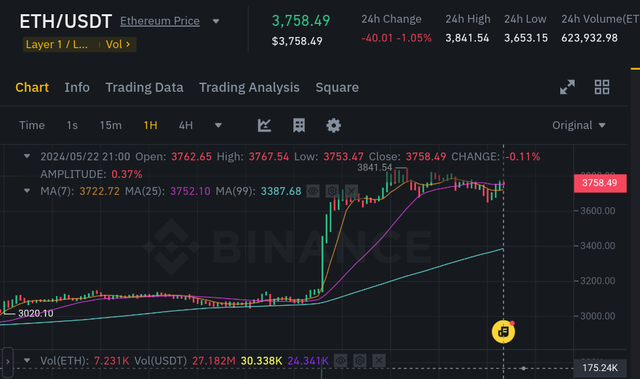 1 Hour time frame 1 Hour time frame |
|---|
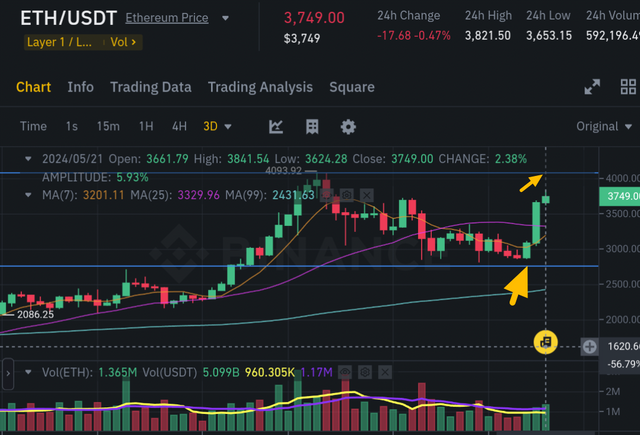
Similar to a brief video clip, medium-term charts (1-4 hours) show trends and patterns. Daily, weekly, and monthly long-term charts show the big picture, much like a full-length film.
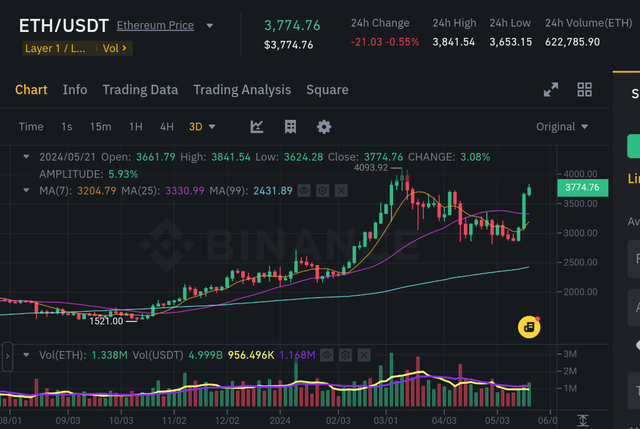 3 day time frame 3 day time frame |
|---|
Look for patterns (such as head and shoulders or triangles), trends (series of green or red candles), and wick sizes (long wicks indicate significant buying or selling pressure) when examining candlestick charts.
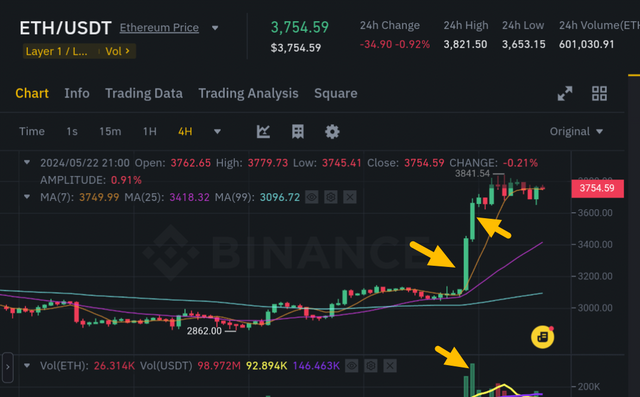 Candle bodies indication "Ethereum" Candle bodies indication "Ethereum" |
|---|
Also, study the body size (large bodies mean strong price movements) and support and resistance levels (where candles bounce off or break through). By combining these clues, you'll become a master chart reader!
Short-term charts help you time your entries and exits, like a precision timer. Medium-term charts guide your trade management, like a navigation system.
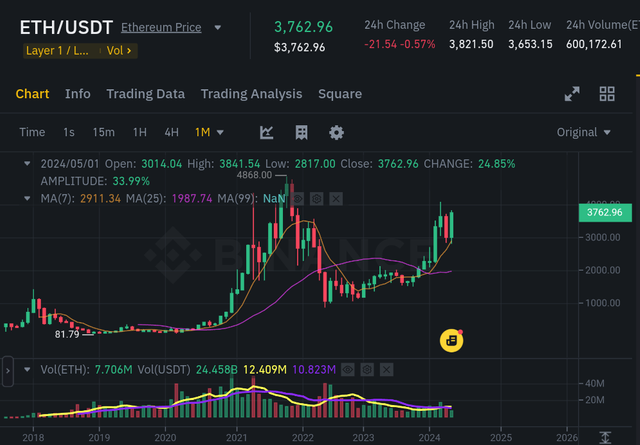 Long term indication "1 Month time frame" Long term indication "1 Month time frame" |
|---|
Long-term charts provide the overall direction, like a compass. By using different time frames, you'll trade with confidence and clarity. Remember, charts are tools, not guarantees, so always combine them with other analysis for a winning strategy.
Timing is crucial while trading. You may synchronize your trades with the rhythm of the market by using different time frames. You can stay in tune with the market's pulse by using short-term, medium-term, and long-term charts, which help you ride the waves and stay aligned with the tides. You may learn to trade like a pro by studying candlestick charts and experimenting with different time frames.
Define chart patterns and differentiate between continuation patterns and reversal patterns. How can chart patterns be utilized to set effective stop-loss orders? |
|---|
Chart patterns, which resemble well-known forms on a map, aid in guiding us through the ups and downs of the market. They are created by periodic price swings that provide us with hints about potential future developments.
Reversal patterns and continuation patterns are the two primary categories. Triangles and flags are examples of continuation patterns that indicate the present trend will continue. Head and shoulders and double tops are examples of reversal patterns that alert us when a trend change is imminent.
Reversal patterns alert us to impending change and advise us to exercise caution. They assist us in locating critical levels of resistance and support where the price may test or beyond them.
 Setting Stop loss effectively Setting Stop loss effectively |
|---|
Through the identification of these patterns, we can impose appropriate stop-loss strategies to restrict our losses or preserve our gains. For instance, we can place our stop-loss below them the neckline, where the price is probably going to break through, if we see a head and shoulders pattern or else for example let me show i found Bearish Wedge in "Fontom/USDT" .
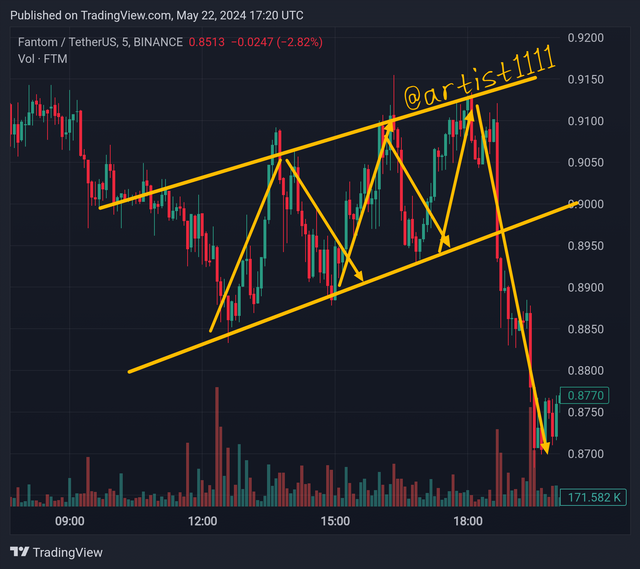 Bearish Wedge "FTM/USDT" Bearish Wedge "FTM/USDT" |
|---|
We may reduce our risks and make more informed trading decisions by using chart structures to establish stop-loss orders. It's like having a reliable guide to steer us through the ups and downs of the market. We can confidently weather market turbulence because we have stop-loss orders in place to safeguard ourselves.
Chart patterns can be used in association with other trading tools to produce a profitable trading strategy that advances our trading objectives.
What is Trading View and how can it be used to apply technical indicators in real-time trading? Describe the relationship between support and resistance levels and how technical indicators can aid in understanding these concepts. |
|---|
Trading View😳... Hmmm, trading functions as a useful investment navigator, making it an invaluable tool for traders. Charts, indicators, and strategies can be developed and transmitted with others using this website and app.
Your trade abilities will develop as a result of this community sharing. The technical parameters function similarly to customized algorithms in aiding the comprehension of developments in the market.
You may add several indicators, ranging in complexity from basic to sophisticated, to your spreadsheets using Trading View. Making sensible trading selections is facilitated by your ability to recognize patterns.
With Trading View's real-time updates, you can respond to changes in the market swiftly. Your indications rapidly update in response to price changes, assisting you in making quick judgments.
Better yet, you might set up alerts to notify you when significant incidents take place. Trading View combines the technical indicators with real-time data to enable you to come to adequately informed trading decisions.
It provides astute guidance to ensure your success, akin to having a personal trading assistant. Regardless of your level of trading experience, Trading View is a great tool for improving your skills and reaching what you want to achieve.
Similar to a floor and ceiling for prices, support and resistance levels exist. Resistance is the point at which prices struck a wall and began to decline again, whereas support is the level at which prices, like a trampoline, bounce back up. These levels aid traders in determining potential future price movements.
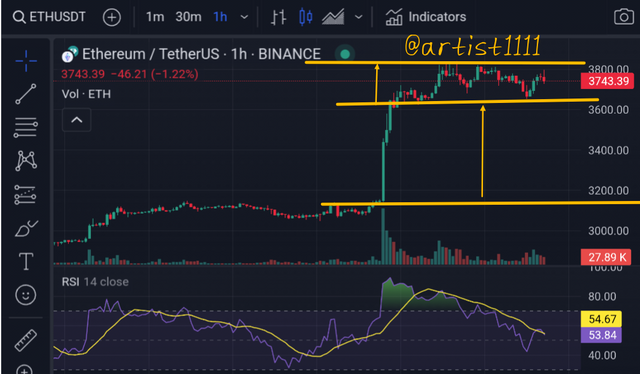 Support and Resistance level "RSI Indicator" Support and Resistance level "RSI Indicator" |
|---|
Technical indicators are like special tools that help us spot support and resistance levels. Relative Strength Index (RSI) and Moving Averages are two examples of indicators that help us see where prices are trending as well as potential reversals or breakthroughs. This aids in our ability to make wise trading choices.
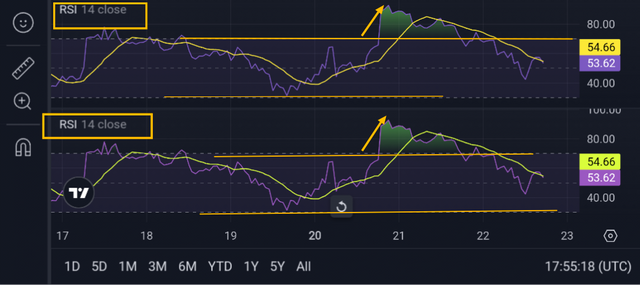 RSI INDICATOR RSI INDICATOR |
|---|
Indicators might indicate whether a price is likely to break through or rebound from a resistance level. Similar to this, indications can tell us if prices are likely to rise again or continue to decline once they reach a support level. This assists us in placing stop-loss orders and timing our earnings.
Provide an overview of pivot points and discuss their calculation and significance in trading. Explain how to configure and trade with pivot points, including strategies for pivot point reverse trading. |
|---|
Pivot points are like markers on a map, guiding traders through the market. The high, low, and closing prices from the previous day are used to calculate them.
This establishes a benchmark for the day's price movement, assisting traders in making wise choices. Simple math is used to calculate pivot points.
The basic floor pivot point, for instance, sums the closing, high, and low prices before dividing by three. As a result, a pivot point is formed, with support and resistance levels below and above.
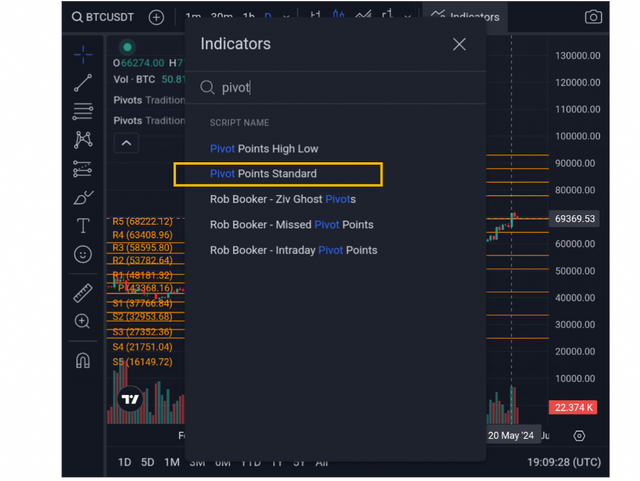 Pivotal indicator Pivotal indicator |
|---|
In trading, pivot points are crucial as they indicate crucial levels of support & resistance. It is positive if the price is above the pivot point. It is bearish if it's below. Pivot points are used by traders to identify opportunities for trading, create stop-loss orders, & take profits.
Traders can improve their understanding of market dynamics and make better-informed choices by employing pivot points. They are an effective yet basic tool that support traders in concentrating on important levels.
Regardless of your level of experience, pivot points are an invaluable tool for enhancing your trading abilities.
Traders utilize pivot points, a well-liked technical analysis tool, to pinpoint important market support and resistance levels. They serve as a benchmark for the price action of the current day and are computed using the price action of the prior day.
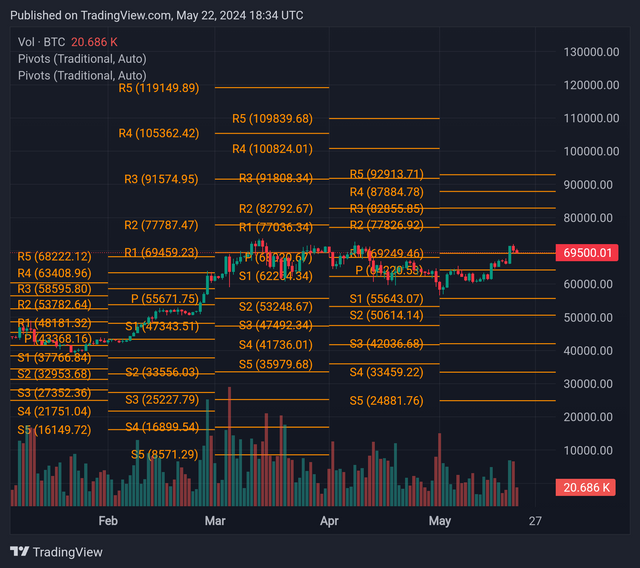 Pivot Point indicator Pivot Point indicator |
|---|
Pivot points are useful for traders who want to identify potential trading opportunities and set stop-loss and take-profit orders.
How it works:
First of all the vary first thing we need to , calculate the pivot point using the previous day's high, low, & closing prices.
Next to it , calculate the support and resistance levels (R1, R.2, S1, S2) by adding or subtracting a percentage (usually 1-2%) from the pivot point.
If the price is above the pivot point, look for buy opportunities at S1 or S,2, with a stop-loss at the next support level & take-profit at R1 or R2.
If the price is below the pivot point like and shot , look for sell opportunities at R1 or R,2, with a stop-loss at the next resistance level and take-profit at S1 or S2.
If in a case the price breaks through a support or resistance level, it may continue in that direction, so adjust your strategy accordingly.
Here's an example:
Pivot point: 100
Support levels: S1 = 98, S2 = 96
Resistance levels: R1 = 102, R2 = 104
If the price is at 101, you could set a buy order at S1 (98); with a stop-loss at S2 (96) and take-profit at R1 (102). If the price falls to 98, it may bounce back up, &if it breaks through 96, it may continue downwards.
Remember, pivot points are just one tool among many, & you should always combine them with other forms of analysis and risk management techniques.
I invite @casv @ngoenyi and @shahidd2030 to join this contest,
kind Regards
@artist1111

Adieu, folks!
May the winds of fortune
carry you to greatness!
May the winds of fortune
carry you to greatness!
Excellent understanding of technical analysis and the way you've described it shows that you have thorough knowledge of the topic.
As seasoned traders we all know how important it is to be aware of the market sentiments and trends. You've done a good job in explaining these topics
Regards,
Dr Huzaifa Naveed
Upvoted. Thank You for sending some of your rewards to @null. It will make Steem stronger.
This is a really informative article. I can't write like this only technical. I am envious :9)

You hit the nail on the head. Using past data to pedict future prices is what technical analysis is all about. It's important for traders to understand that this can make predictions more accurate, though it's not foolproof.
You're absolutely right. This shows why technical analysis is so crucial. It changes trading from random guessing to a more thoughtful and informed process. Knowing these tools helps traders reduce risks and make better decisions.
You’ve got it. Using indicators and patterns helps traders see possible future price movements. By analyzing these, traders can plan strategies to predict market behavior, but it's best to use them with other analysis methods for the best results.
All the best.
@artist1111 This post does an excellent job explaining the importance of technical knowledge in trading. Understanding charts trends and indicators is crucial for making smart decisions. Your guide on reading candlestick charts and using different time frames is very helpful. Utilizing chart patterns and technical indicators can really improve trading strategies.. Good luck with the contest!
You have given a clear and persuasive exposition on the significance of expertise in business. To stress how technical analysis permits traders to operate with historical data, helps communicate its worth. This section, which looks at basic constituents like line charts, bar charts and candlestick charts, fully explains the role these tools play in identifying trends and opportunities in the market. I must congratulate you!
You hit the nail on the head with why knowing technical stuff is so crucial in trading. It's like knowing when to hit the gas or brake while driving. Understanding charts, trends, and indicators is like having a roadmap to make smart decisions in trading. Your breakdown of candlestick charts and using different timeframes is like having a secret weapon to understand the market better. Recognizing chart patterns and using technical indicators is like having special tools to enhance your trading strategies. Wishing you all the best in the contest.
Hello friend I must say in summary that I love the way you explain the pivot point calculation for the benefits of those who don't know anything concerning it, such knowledge is outstanding especially when it's broken down to simpler terms.
I am inviting you to comment on my article through the link below https://steemit.com/hive-108451/@starrchris/sec-s18-w1-or-or-mastering-the-markets-with-technical-analysis
What more is left.
Boss you've Nail it.
Technical Analysis is a very critical concept to traders, it must be well studied, analyze, Synthesize and evaluate to get the best.
It so help traders understand the market previous reactions qnd movement thus predicting the next movement with curiosity, not just a mere assumptions which may likely not correspond.
This is the reason technical Analysis is here for us.
Going through your content I sighted so many tools to explore in getting a premium knowledge of the market.
Understanding the candle format, arrangement, chart patterns and graphs, indicators, pivot points and so many others evaluation a trader wouldn't miss to be the best and successful.
I'm grateful and wishes you best of luck
Also read on mine;
https://steemit.com/hive-108451/@basil20/sec-s18-w1-or-or-mastering-the-markets-with-technical-analysis