DATAPLATE #2: Antacid Doses Up %240 In Iceland As Government Effectiveness Sinks

With turbulent government, stormy stomachs
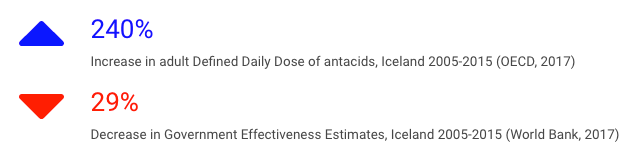
World Bank estimates of overall government effectiveness in Iceland have fallen 29% since 2005 (World Bank, 2015), and this appears to be hurting Icelanders’ bellies: average antacid doses in Icelandic adults have spiked during this same period, up 240% (OECD, 2017).
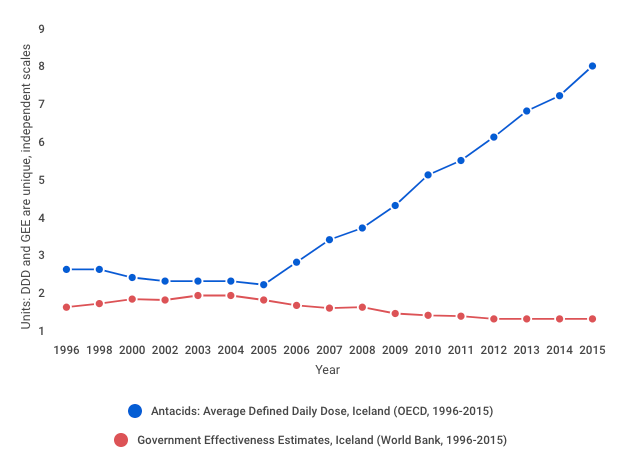
Yearly values in these two variables have reliably risen and fallen together, in the inverse, since 1996, so the relation between them is nothing new. What is interesting that, suddenly and simultaneously, both switched their respective trend-directions in 2004 - 2005: antacid doses began climbing yearly after a decade of slow decreases, while government effectiveness slowly sank after its decade long, slow rise. See the chart below: whatever is causing the relationship here, it manifested a dramatic one-eighty in the mid 2000s.
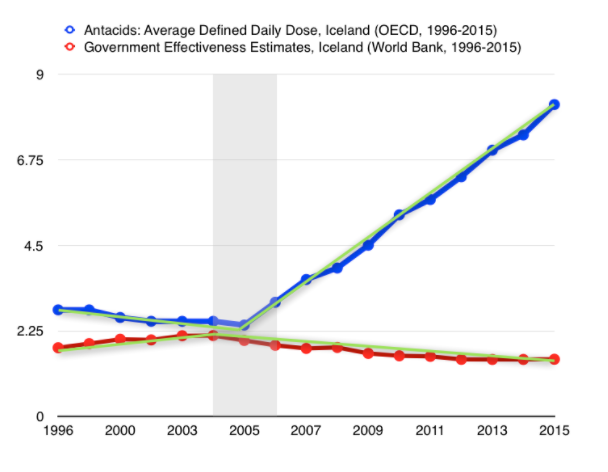
This about-face in the data is expressed in more detail below, using the same line chart, but with green, angled trend lines. The grey shaded square calls attention to the time period when these trend-reversals took place.
A very strong relationship indeed
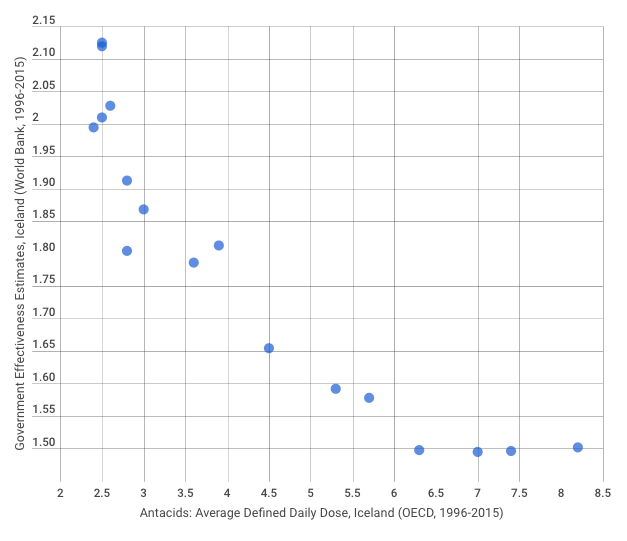
A strong and significant relationship between government effectiveness and average antacid dose in Iceland was detected using regression analysis, yielding an R-Squared value of .85 (p = <.001). This value is statistically large enough to suggests a causal role for governmental effectiveness in changing rate of antacid dosage in Iceland. See the scatterplot below for a visual representation of this relationship.
A unique association
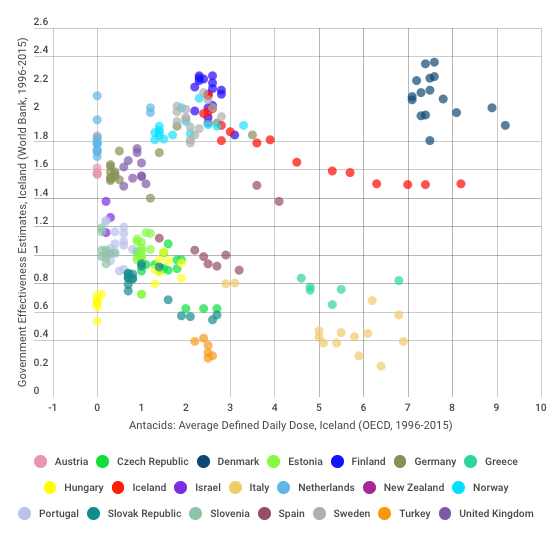
Is Iceland alone in this association? Strictly speaking, yes, Iceland is the only country where the relationship between these variables is obvious: The scatterplot below tracks all available Government Effectiveness Estimates from the World Bank (2017) against all average adult Defined Daily Doses of antacids (OECD, 2017) for all countries. The crucial point to note of course is that only Iceland shows this marked, obvious linear association between the variables of interest (track the red dots) in the chart below.
Among six other countries in the data where the relationship between government effectiveness and antacid dose was found to be significant (p = <0.05), none showed this linear relationship, as is observed in the Icelandic data subset. In the scatterplot below, we plot all countries where a significant relationship between antacid dose and government effectiveness was detected (Iceland again shown in red).
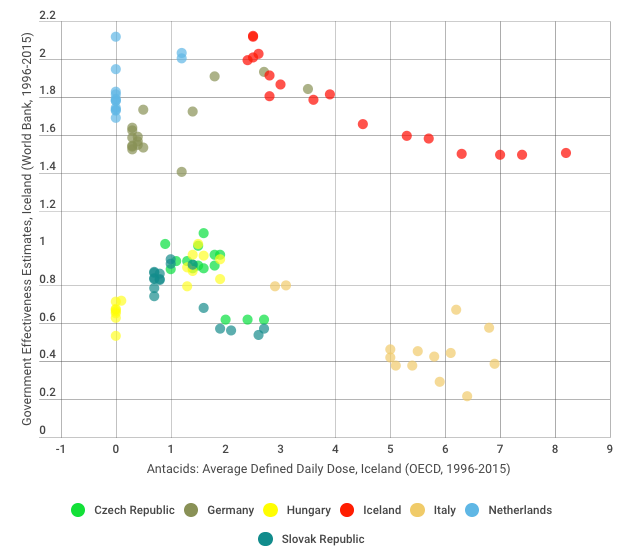
Above, the relationship between measures of interest among the data-subsets of other statistically significant countries is much less-clearcut than is the case for Iceland. There we see, again, a smooth and mostly linear relationship between measures.
A downstream effect
To sum up, we know the relationship is there, and that it's unique to Iceland. So what's going on? Certainly it is basic that with incremental decreases in government effectiveness, life stressors in a population will rise, leading to higher rates of stomach discomfort on average. Naturally, we'll then expect to see more people looking for relief in antacids, as we’re known to do.
The question of course is why this principle has been so pronounced in Iceland during the past decade. Why did Icelander's all of a sudden become more likely to take more antacids for these stress-related stomach issues? The truth of the matter is certainly more complex than a one-to-one causal relationship between two variables, and the relationships seen here certainly needs to be unwound through complex research projects beyond the available data. Nonetheless, the strength and linearity of the the statical relationship observed here, and the fact that it is observed so succinctly for in one country only among many, does suggest this relationship is not only real, but determined by country/culture specific factors.
Data sources: