COMPARISON OF CAR THEFT DURING 10 YEARS II IELTS WRITING #2
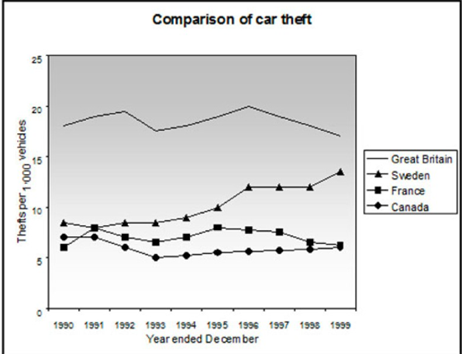
This line graph shows us about the comparison of car theft per 1000 vehicles among 4 countries during 10 years from 1990-1999. It is clear that Great Britain is the highest of theft among other countries in this graph between 15-20.
In the beginning, Sweden has a significant increase in theft about 8 to 13 from 1990 until 1999. On the other hand, France's and Canada’s graphs have similarities that have ups and down flow lines. The graph all keep remaining at between 5 to 10 per thousand vehicles.
Interestingly, even though Great Britain is the highest theft among others, but it has fluctuated line graph that there is slightly lower between 1992-1993. And also keep remaining of decrease trend between 1996-1999. However, there is a slight increase of theft cars between 1993-1997 for 4 years in a row at 20.