.The relationship between temperature and vintage score
Wine is made of grapes. The quality of the wine is affected by the quality of the grapes grown. Grape vine wakes up in spring, flowers bloom and grows in the sun light of summer and autumn, yields fruit, fruits are harvested in the fall. In this process, if the temperature and precipitation are adequate and there is no disaster such as frost or hail, grapes in qood quality can be harvested.
Given that the other conditions are the same, how does temperatue affect grape quality in each year? Monthly changes in the temperature all year round affect grape quality. Among the 12 months, which temperature of month has bigger impact on wine quality than the other months.
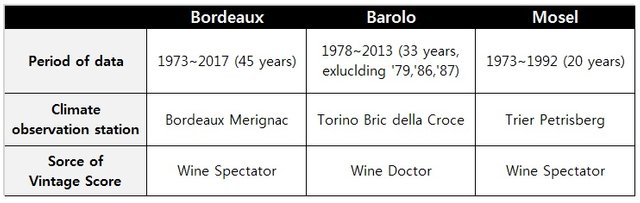
The correlation analysis can give us some insight for that kind of question. The analysis is done with the data of the monthly average temperature and the vintage score in 3 different wine regions (Bordeaux, Barolo and Mosel) for the past 20 to 45 years.
Monthly average temperatures are calculated from the daily average temerature provided by the National Climate Data Center (NCDC) in the US, and vintage scores for the wine quality were collected from Wine Spectator (Bordeaux and Mosel) and Wine Doctor (Barolo)
The Correlation between the vintage score and the monthly average temperature of 12months in the 3 regions is as follows.
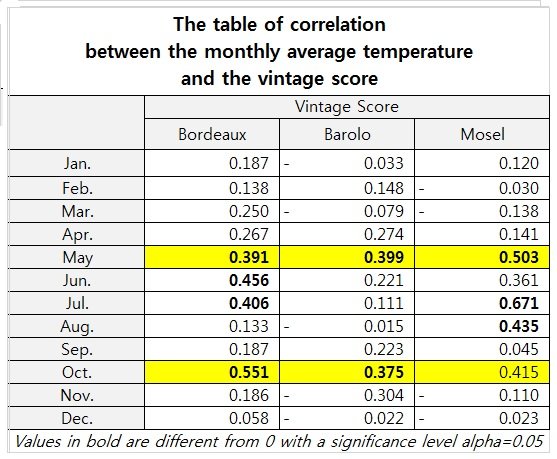
According to statistical analysis, monthly average temperatures in May and October are highly correlated with the vintage scores for the year, although there are some differences depending on the region. (October correlation of 0.415 in Mosel area is verry close to 95% significance level with p-value of 0.061) It is common sense in some way that threre is the strong and significant correlation between the temperature of flowering season in May and the harvesting season in October and grape quality.
Threre are also some regional differences. Temperatures in June and July in Bordeaux, July and August in Mosel are significantly correlated with vintage scores. On the other hand, the temperature of the other months except May and August are statistically insignificant in the Barolo region.
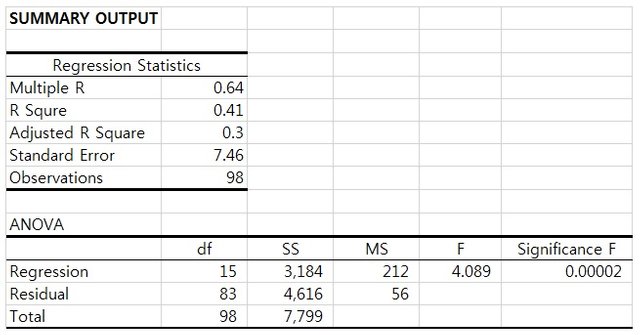
It should be considered that temperatures have only about 30% of explanation to explain vintage scores when undestanding the correlation effects of the months' temperature on wine quality. The remaining 70% cand be explained by other factors that constitute the terroir such as precipitation, frost and etc.. The table below is the results of a linear regression analysis with the 3 regional data altogether. The adjusted R square is 0.30 and the significance F is below 0.01. The adjustred R squares are different when the regression analysis is run by each regional data separately. 0.347 for the Bordeaux region, 0.238 for the Barolo and 0.729 for Mosel. Those results show the regional differences and the wine quality in Mosel, the coldest area among 3 regions, is more affected by temperature than the other regions.
Although there are some limitation in the results due to constraints of data sets (such as the location of the climate observation station), the temperature affects about 30% of the grape quality and the temperatures in May & October are more important for the wine quality in every wine region.
Reference
- Clamatc Data Center (CDO)
- Wine Spectator, Vintage chart
- Bordeaux Vintage Chart (thewinecellerinsider.com)