Do all Data Scientists engage in data visualization?
Yes, as a data scientist you need (and have) to visualize the results of your analysis in order to understand better and find insights.
So the visualization of data is a very important part of the data analysis process and you just can’t do without it in some domains of data.
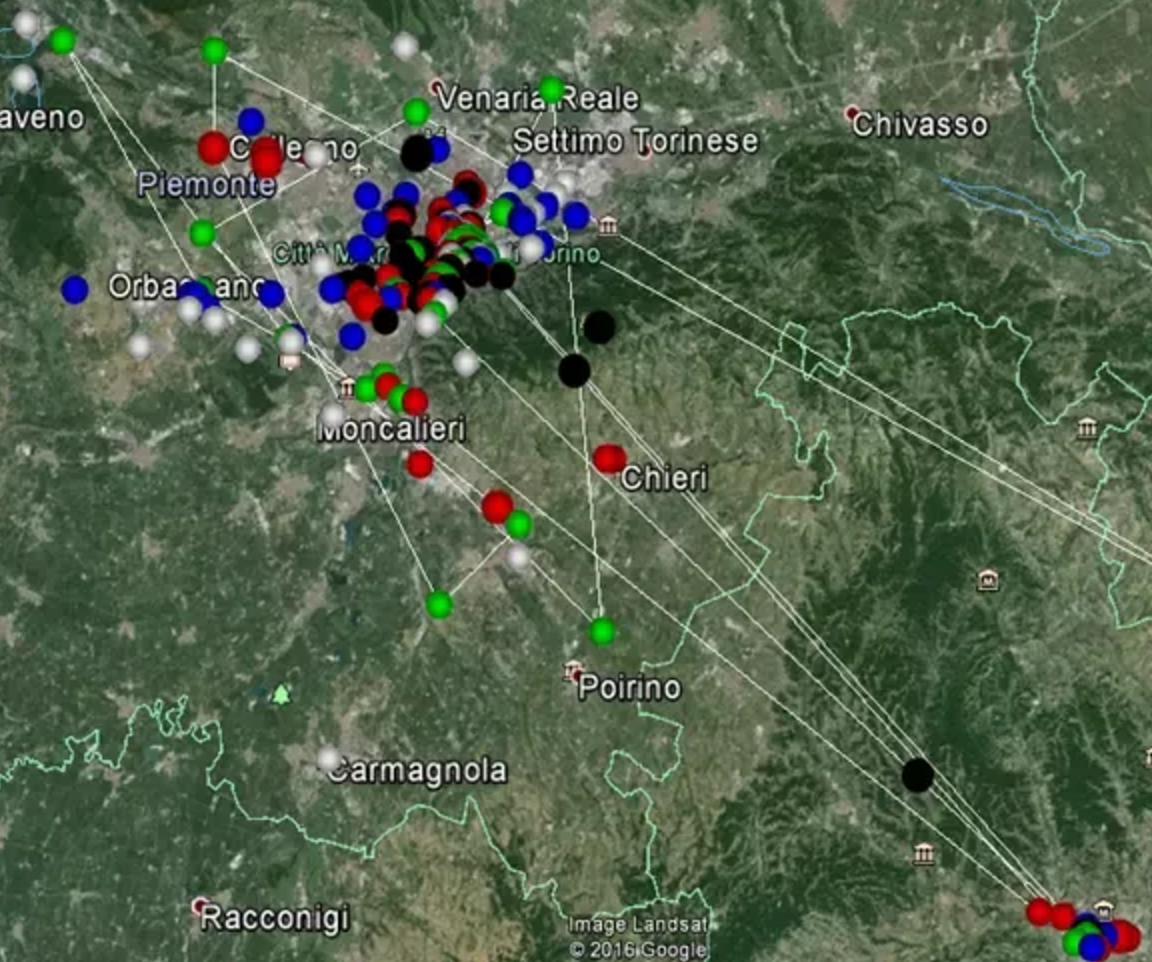
As an example, if you are analyzing location data such as geo-tagged pictures or geo-tagged tweets visualization of data is crucial. If you don't visualize the data in a map you cant even imagine what are those data about and infer or understand something useful about it.
The picture below is shows a visualization of geo-referenced data from different social networks one of each color . By sorting the data by timestamp the track of the user can be seen.

Interesting