$VIA/BTC Technical Analysis "Hearth of the Underdog"
Hello Steemers!
Today I decided to chart an rather old altcoin, Viacoin.
I think that the $VIA chart is particularly interesting and offers some good speculation opportunity.
I will explain more on why i chose VIA and more in the comment.
The chart will be Poloniex based, and i will cover weekly and daily intervals.
As usual my charts will start off messy and end up cleaner towards the end.
Legend
Purple dashed lines - weekly previous support, should act as new resistance
Light blue dashed lines - daily previous support which should act as new resistance
WEEKLY BASED CHART/TARGETS
Let's start off with the weekly interval.
I will also show how the weekly interval looks on the daily, just so everyone gets a feeling where i drew all the lines from.
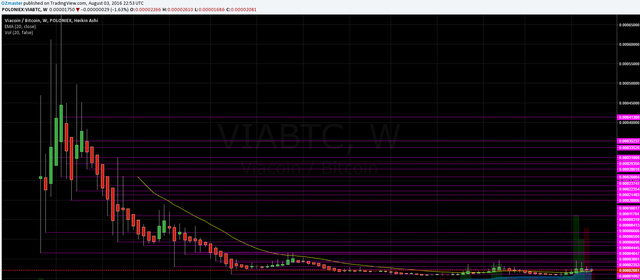
1 week chart Poloniex + previous low marked on daily- 04/08/16
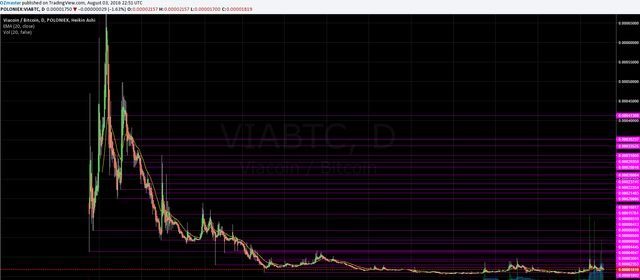
1 day chart Poloniex + previous low marked - 04/08/16
Previous support levels marked out as usual, yet this time I didn't mark previous resistance level.
More on why so in the comment.
You can see how the price already used some of the old support points to make new resistance,
especially in the lower price area of the chart.
As I usually do, I'll put on a fib which will help me clean out the chart and recognize some targets worth aiming for in this longer weekly time period.
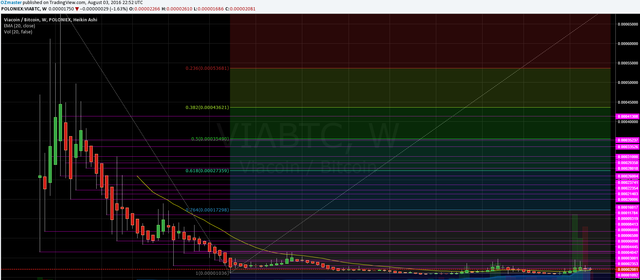
1 week chart Poloniex + fib + previous low marked on daily- 04/08/16
1 day chart Poloniex + fib + previous low marked on daily- 04/08/16
The weekly fib won't really help in the price range we are now but should be considered important
in the bigger picture/longer run.
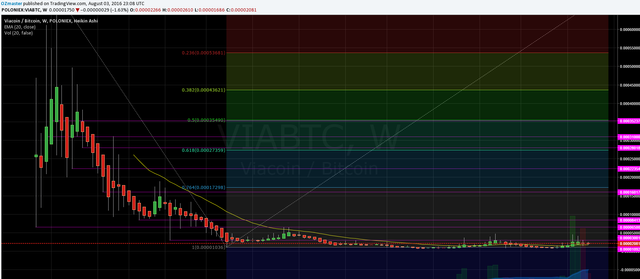
1 week chart Poloniex + fib + clean + previous low marked on daily- 04/08/16
I left the previous support lines which closely correlate with the weekly fib lines or which I noticed have played an role in the history of the price. Those should be key points, or rather zones, of resistance in the future.
DAILY BASED CHART/TARGETS
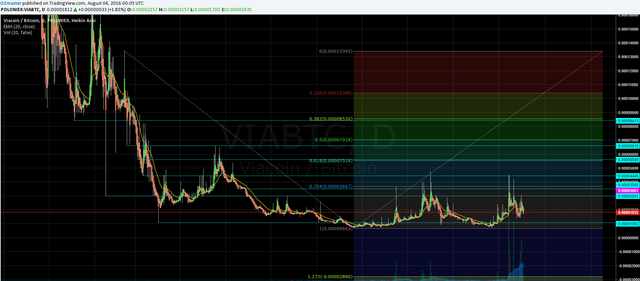
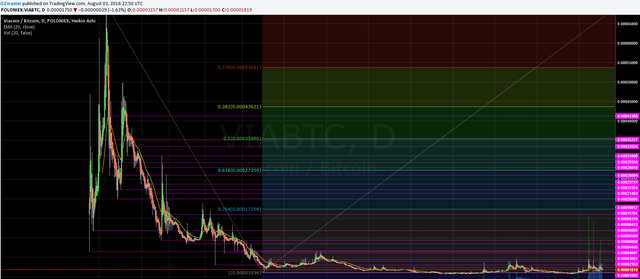
1 day chart Poloniex, daily targets + fib + clean + previous low marked- 04/08/16
As you can see even on the daily chart we are quite low in the price action.
COMMENT
This time I will post the comment by commenting as it involves my personal opinion on the coin!
Thank you for understanding!
If anyone has any questions or need's help fell free to ask, I will try to explain as fast and as best as I can.
Critics, comments, reply's, counters, advice's, etc. are always welcome!
Have my charts helped you in any way?Let me know with a comment below :)
Are there more people who are doing TA?
DISCLAIMER
I am showing multiple scenarios on the price movement, in the post itself I do not take any stance, either bullish or bearish. I am not responsible for neither you’re winning nor you're losses upon trading! the "comment" section is my personal opinion and does not mean I have to or do hold any positions in the given market.
Kind Regards, OZ :)
Before I start commenting the charts, I have to comment on why I picked Via, why I think it has an interesting chart and why I think it's good to analyse.
I have been following #Viacoin for quite a while now. The chart drew my attention as it never seemed to have a real pump after the initial one, it was just downtrend, yet the coin remained on a respectful position on the coinmarketcap. It is one of the rare crypto coins out there which offer an view into long term trading, with targets that reach far into the future.
Another thing I want to explain is why I didn't mark any of the previous highs, which should act as a support resistance. I'll provide you with what will seem possibly the dumbest answer ever, I think the upwards potential on $VIA is gigantically bigger then the downwards one having no reason to react on price movements in a time range I do not plan to put my targets on.
The coin seemed dead for quite some time, but at the end of 2015, beginning 2016. $VIA seemed to have found a bottom, and for the first time started showing some volume, it was very low, but was still there.
That indicated that accumulation time has started, in which zone we still are, if you take a closer look at the daily target chart, the price is still trending between the bottom 2 lines, and has been even before reaching the bottom and nearly the whole time since mid March 2015.
IMO it is obvious there is some really heavy accumulation going on.
In the last 3-4 months we had massive spikes in volume, happening on a more frequent basis as the time goes by.
That tells me that it is only a matter of time before we see a break upwards out of the accumulation zone, which seems to be topped at around ~3k satoshi. Furthermore It is very likely possible that it will act as a new support level.
Since $VIA is such an old, yet shows it's not dead yet, I firmly believe the daily trading is just noise of the accumulators which should be ignored, and ones targets based on the weekly chart.
As you can see on the weekly chart the price had a major downtrend since the beginning, with a very long accumulation time, which we are still in, yet since the accumulation time is already taking so long, the price could explode at any given moment, hence why I suggest to ignore the "daily noise". The volume is showing pretty strong upwards moves and the price is slowly but accordingly moving onward setting slightly higher price flours .
IMO $VIA offers a huge opportunity, but of course with equivalently big risk, there is no guarantee that the price will reach Pluto, but the upwards potential definitely offers a nice investment opportunity and a possibly volatile and highly populated market.
Recently the max planned supply of Viacoin was cut down, and if I'm correct that means that already about 95% of the Viacoins are mined, which also could have a giant impact, or rather boost of the market movement and direction.
nice charts @ozmaster @ozchartart

Give me your twitter if you have it and do not mind I will follow you :)
Thanks!
sure here it is:
https://twitter.com/OZmasterCB
althou I don't really psot much on twitter.
I will leave u guys for tonight, will reply to the comments when i wake up, aswell to the comments fo the new 5th Daily STEEM/BTC price, (check @ozchartart blog for more info)
thanks for your twitter, see you back later, cheers
@ozmaster
Thanks man! cheers!
Enjoying your charts!
thanks! glad you are!
Upvoted