$VTC/BTC Technical Analysis May. 23, 2017.
Hello Steemers!

For today a chart on request, @steemed asked me to make a Vertcoin $VTC chart.
VTC is one of my favorites, so requested or not, I'm more then glad to post this one.
I already made a post about it very early on on Steemit (https://steemit.com/trading-analysis/@ozmaster/vtc-vertcoin-charts-and-comment), and the chart will be more or less unchanged since then, since it's been providing all that's needed for me ever since.
At the moment $VTC is ranked 90th on the coinmarketcap
For more info about Vertcoin, check out their website and Bitcointalk thread:
Website - https://vertcoin.org/
BCT thread - https://bitcointalk.org/index.php?topic=1828453
Starting of with some clean charts and then gonna switch over to the full charts with fibs and lines, since i have it for a very, very very long time alreardy.
Will be showing, the daily, weekly and monthly.

Monthly
Weekly
Weekly - recent
Daily
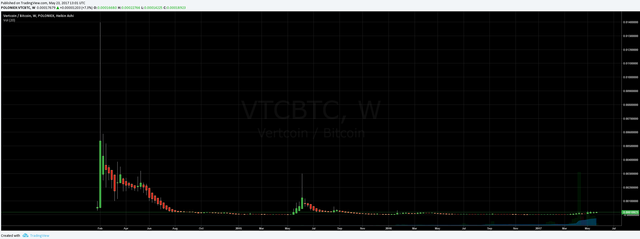
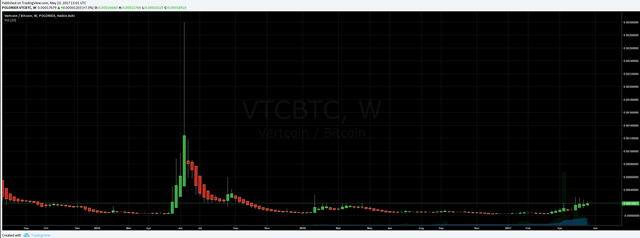
$VTC had a massive pump at start of April 2014, reaching all time high of 0.01389 BTC.
It then had more then a year of downtrend reaching it's all time low of just at 2254 satoshi in May 2015.
After making the all time low of 2254 satoshi it started going up once again making a massive pump, reaching the top at 300k satoshi over just 4 weeks time.
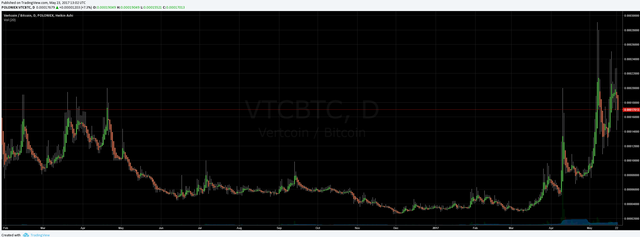
Once again the price turned after hitting the 300k mark and started going down, with some bounces along the way it reached a new local low of 2.6k satoshi at end of 2016 and has turned since, this time not with an aggressive uptrend, but rather slowly progressing through previously made resistance areas, at the moment being traded around 20k satoshi.
Notice how the trading volume, over time, has been constantly going up, unlike the price which has been going down in a larger scale of time.
Now the charts with the lines, fibs and other stuff i like to show you.
Monthly
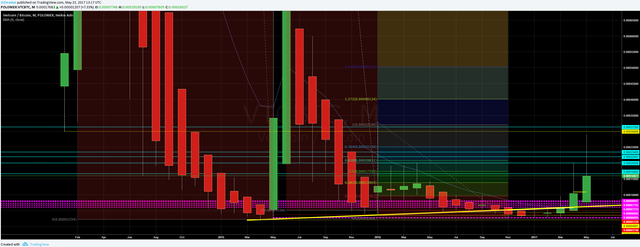
*Monthly - zoomed *
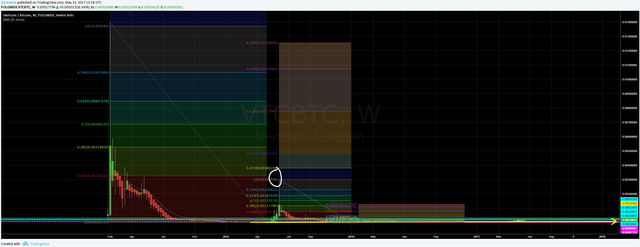
Weekly
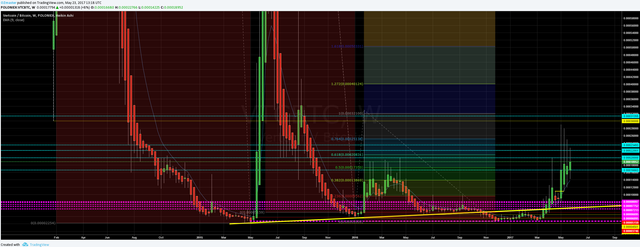
Weekly - zoomed
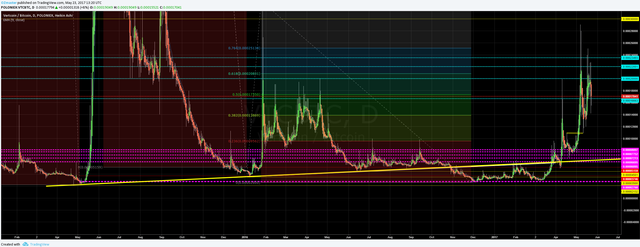
Daily
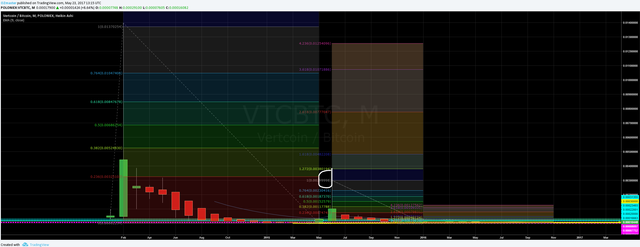
You can see how i pulled 3 fib's, big, middle, small so to say, I believe each ones can give some good information to base our trades on.
Most of the resistance/support lines are in the lowest levels of the chart(where most of the purple lines are), which means that the resistance was hardest at those levels, pre 10k satoshi levels (yellow rectangle), and you can see how it recently took quite some time for the price to break upwards from 10k satoshi, being the longest period that VTC has traded on a certain price level.
It is also clear to see how the recent 2.6k satoshi local low was in a big picture a higher local low using the support levels made in the history of the trading.
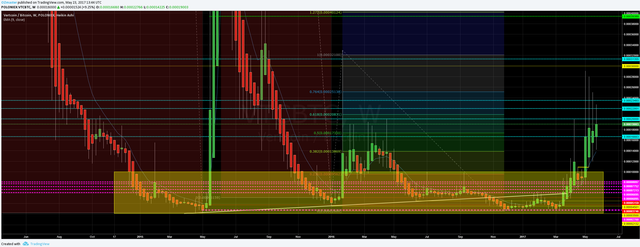
As we go up the next price level looks to be 10k to 30k satoshi(marked with blue rectangle).
in this level the volatility is picking up a bit, due to the historical resistance/ support points being more apart from each other.
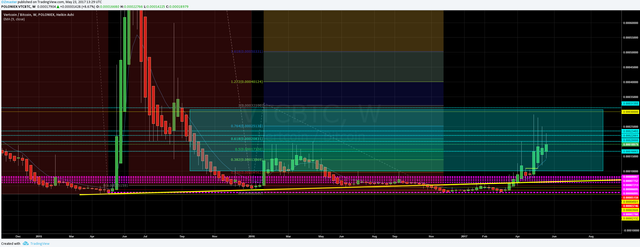
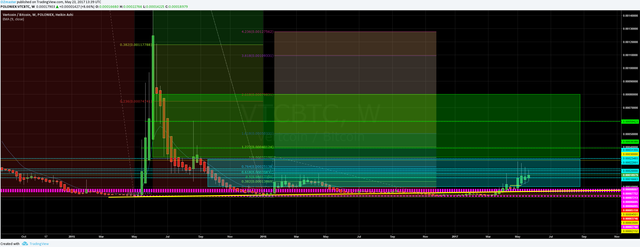
The next zone I see coming is the one till about 80k satoshi (green rectangle), where I expect mostly the fib levels to be used as support and resistance, as well as the 39.4k and the 59.4k satoshi lines which i just added for a bit more clear view in that particular price area. Volatility is expected to pick up even harder.
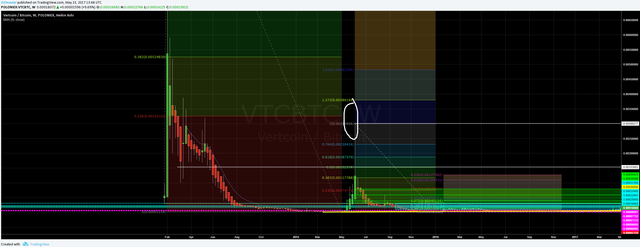
Finally, what i call higher level's of the chart, where the price has been traded with great volatility, leaving us only with a few historical indications, where, along with the fib levels, I expect the ~150k, and the ~300k levels to play an important roles.
COMMENT
Once again, I will post the comment by commenting as it involves my personal opinion!
Thank you for understanding!
If anyone has any questions or need's help fell free to ask, I will try to explain as fast and as best as I can.
Critics, comments, reply's, counters, advice's, etc. are always welcome!
Have my charts helped you in any way?Let me know with a comment below :)
Are there more people who are doing TA?
Please post the links to your TA's posts into the comments as well!
DISCLAIMER
I am showing multiple scenarios on the price movement, in the post itself I do not take any stance, either bullish or bearish. I am not responsible for neither you’re winning nor you're losses upon trading! the "comment" section is my personal opinion and does not mean I have to or do hold any positions in the given market.
Everyone who uses TA develops his own unique charting style, please keep that in mind.
Kind Regards, OZ :)

COMMENT
Overall I expect VTC to be going up in the next few months (in the larger time frame), slowly but surely breaking it's resistances.
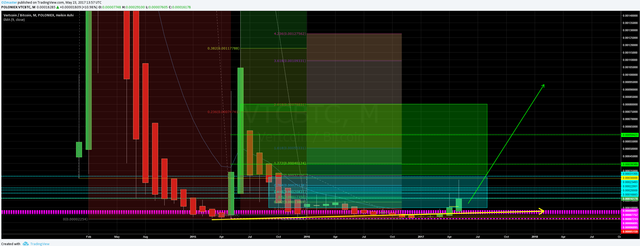
In the weekly aspect I would expect the price to trade a little bit more in the 10k to 30k levels before leveling up into the next area,,, (there is an "or" after the screenshot)
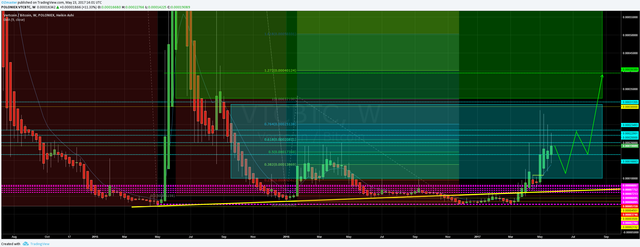
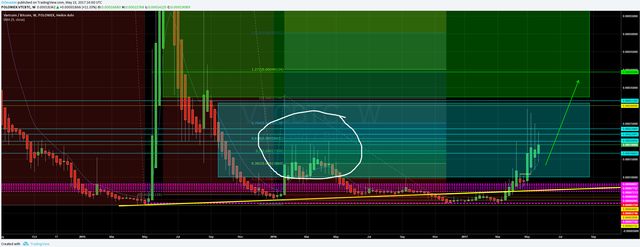
,,,or leveling up from that area soon given that it was traded there at start of 2016 and might be running out of resistance there.
Thank you for the price movements analysis.
VTC is not well known.
What is the objective of this coin? What problem does it plan to solve?
VTC is a very old coin, they have stealth addresses and segwit recently activated, but for the full description please visit their website and forum thread which i linked aboe
Nice appereance @ozchartart, Great news from you
great post!
rs and upvote for you....