Two and three dimensional plotting with 'Octave'
Greetings, in this tutorial we will deeply focus on plotting a function on Octave. To have a background information or if you're wondering what is Octave, i strongly recommend to take a look at my introduction to Octave tutorial. To plot a function in two dimensional cartesian coordinate system we need two variables and an equation showing how dependent these two variables are. To denote these two variables similar to axes, 'x' and 'y' letters will be used.Below are some primitive simple equations that can even be plotted by hand with some basic math,
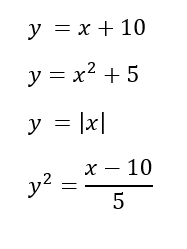
Above equations are relatively easy to draw by hand after finding critical points and by simply plugging some sample x values to observe the behaviour of y. However not every function is as easy as the above ones. Some functions require more effort and computation to plot by hand. In these circumstances it's much more efficient to use a software capable of plotting & calculating complex functions. Below are some examples of such functions,
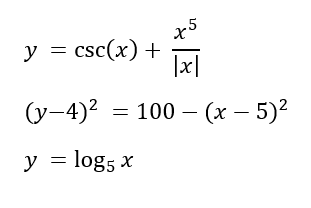
As you can see above functions are quite time consuming to solve by hand. Thereby we will use the plot function of Octave to witness their behaviour.
The very first thing we need to do is to define the range of x so that our graph will picture that interval.
To do that we can write the below code on Octave's command window,
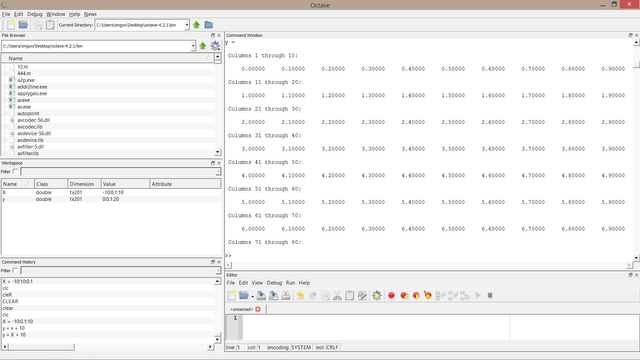
X = -10:0.1:10
Which will give us a 1x201 matrix consisting of rational numbers from -10 to 10 with an increase of .1
So it will go like, -10, -9.9, -9.8, -9.7, .... 9.7, 9.8, 9.9, 10.
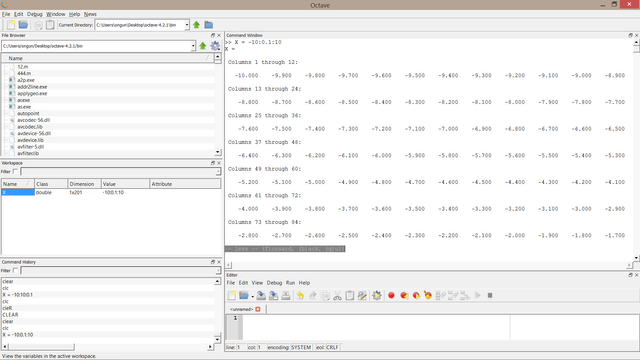
Then simply define y according to x. I will first do it for the x+10 example,
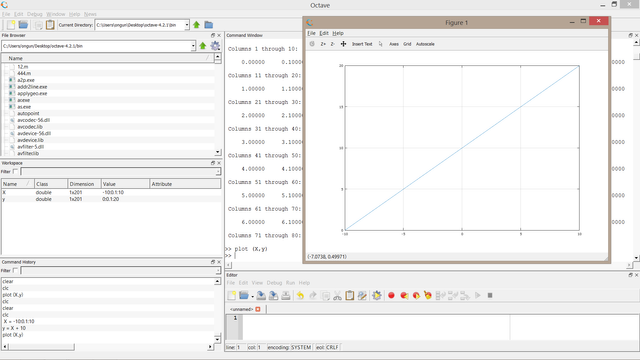
y = X + 10
Which is simply adding ten to all x values,
And then to plot simply wrote the code below,
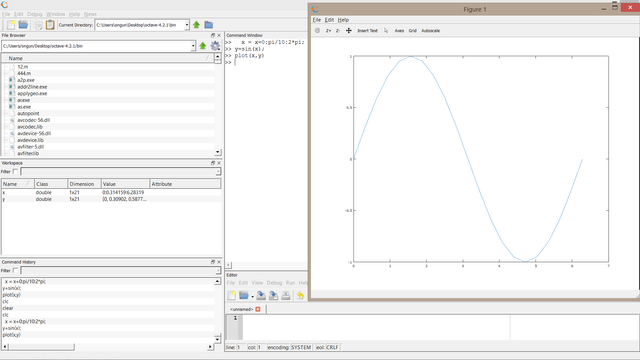
To proceed this time we will do it for relatively complex functions, First one will sin and cos function,
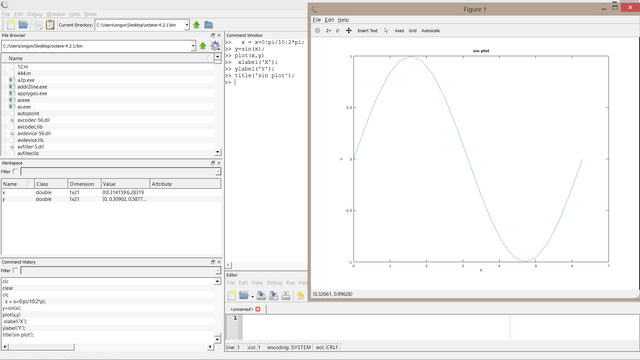
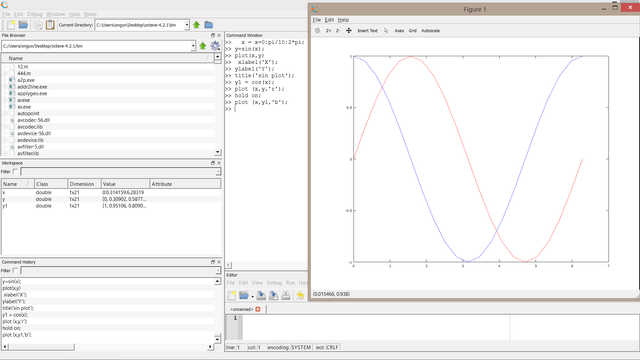
Then as a second task we can label x and y axes and name our plot with the following code,
and to add cos function to the same ploot and change the color of sin function to red, cos to blue we can write the below code,
x = x=0:pi/10:2*pi;
y=sin(x);
plot(x,y)
xlabel('X');
ylabel('Y');
title('sin plot');
y1 = cos(x);
plot (x,y,'r');
hold on;
plot (x,y1,'b');
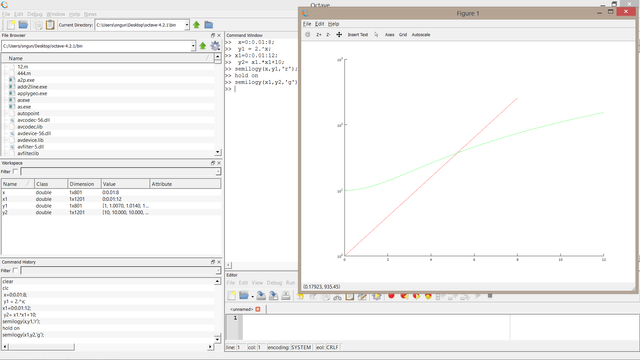
Briefly in the above plot the blue wave shows cos and red sin function in the interval of 0 to 2*pi or 360 degrees. To draw a graph on logarithmic scale, Meaning the y axes will be marked acording to the powers of ten. Mostly used when there is a large number of quantity. Lets draw 2^x and x^x+10 on logarithmic scale,
x=0:0.01:8;
y1 = 2.^x;
x1=0:0.01:12;
y2= x1.*x1+10;
semilogy(x,y1,'r');
hold on;
semilogy(x1,y2,'g');
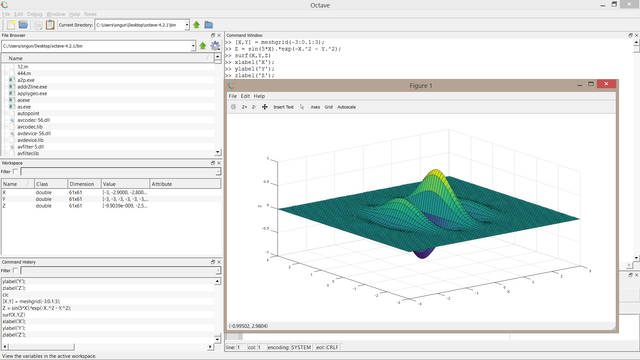
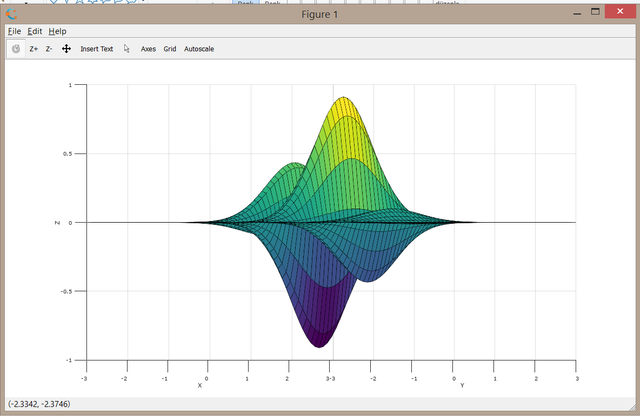
And finally to draw a 3D plot we need to first define the two coordinates or surface of our design,
[X,Y] = meshgrid(-3:0.1:3);
Then the Z coordinate dependent to X and Y,
Z = sin(5X).exp(-X.^2 - Y.^2);
And surface command to plot it,
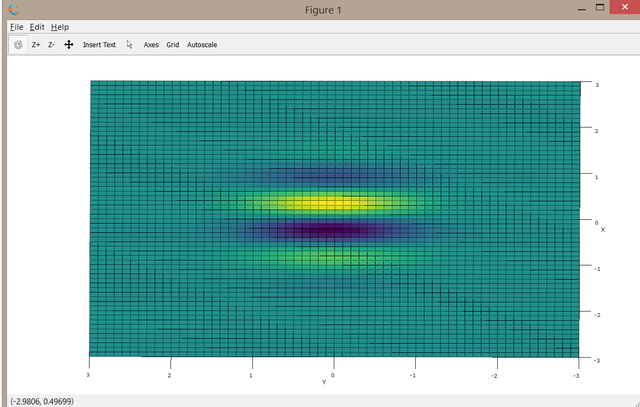
surf(X,Y,Z)
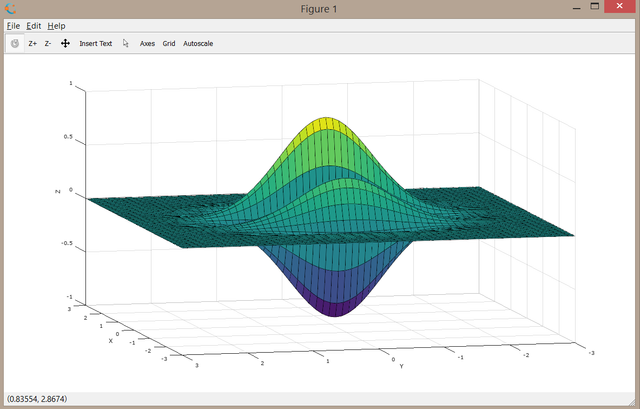
Few labelling and here we go,
[X,Y] = meshgrid(-3:0.1:3);
Z = sin(5X).exp(-X.^2 - Y.^2);
surf(X,Y,Z)
xlabel('X');
ylabel('Y');
zlabel('Z');
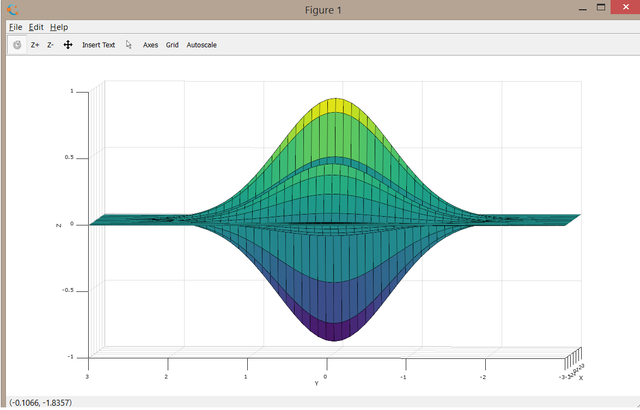
From different angles our plot will look like this,
With your support,
Octave Github repository
@wodsuz ©
Posted on Utopian.io - Rewarding Open Source Contributors
Congratulations @wodsuz! You have completed some achievement on Steemit and have been rewarded with new badge(s) :
Click on any badge to view your own Board of Honor on SteemitBoard.
For more information about SteemitBoard, click here
If you no longer want to receive notifications, reply to this comment with the word
STOPThank you for the contribution. It has been approved.
You can contact us on Discord.
[utopian-moderator]
Hey @wodsuz I am @utopian-io. I have just upvoted you!
Achievements
Suggestions
Get Noticed!
Community-Driven Witness!
I am the first and only Steem Community-Driven Witness. Participate on Discord. Lets GROW TOGETHER!
Up-vote this comment to grow my power and help Open Source contributions like this one. Want to chat? Join me on Discord https://discord.gg/Pc8HG9x