Dice rolling simulation with the aid of Octave part-2

Image source
What Will I Learn?
Greetings, in this tutorial we will continue our dice rolling experiment by increasing the amount trials. To do that we modified the diceroll function that we used in previous tutorial to 1000 and 10.000 trials.
- You will learn Monte Carlo method
- Probobility distribution of dice rolling
- Function writing in Octave
- Bar plotting with Octave
Requirements
- Octave 4.2
- Basic knowledge on coding
- Basic knowledge on probablity distribution
- Information about Monte Carlo method
Difficulty
- Intermediate
Tutorial Contents
In this tutorial we will continue our sampling experiment with 1000 and 10.000 trials,
For 1000 trials
function [retval] = diceroll (x)
trials = 'How many times you want to roll the dice? ';
x = input(trials);
matrix = randi([1,6],1,x);
numberone = sum(matrix(:) == 1);
numbertwo = sum(matrix(:) == 2);
numberthree = sum(matrix(:) == 3);
numberfour = sum(matrix(:) == 4);
numberfive = sum(matrix(:) == 5);
numbersix = sum(matrix(:) == 6);
x0 = 1:1:6;
y1 = [numberone, numbertwo, numberthree, numberfour, numberfive, numbersix];
bar(x0,y1)
title(['Probability of getting 1,2,3,4,5 or 6 on ',num2str(x),' trials.'],'FontSize',22,'Color','r')
xlabel('Results; (1-6) For dice values.','FontSize',22)
ylabel('Total number of head and tails','FontSize',22)
numberoneper = (numberone * 100 ) / (x);
numbertwoper = (numbertwo * 100)  / x;
numberthreeper = (numberthree * 100) /x;
numberfourper = (numberfour * 100) / x;
numberfiveper = (numberfive * 100) / x;
numbersixper = (numbersix * 100) / x;
x1=0.8;
x2=1.8;
x3=2.8;
x4=3.8;
x5=4.8;
x6=5.8;
txt1 = ['%',num2str(numberoneper)];
t = text(x1,20,txt1,'Color','white','FontSize',14);
>txt2 = ['%',num2str(numbertwoper)];
t2 = text(x2,20,txt2,'Color','white','FontSize',14);
txt3 = ['%',num2str(numberthreeper)];
t3 = text(x3,20,txt3,'Color','white','FontSize',14);
txt4 = ['%',num2str(numberfourper)];
t4 = text(x4,20,txt4,'Color','white','FontSize',14);
txt5 = ['%',num2str(numberfiveper)];
t5 = text(x5,20,txt5,'Color','white','FontSize',14);
txt6 = ['%',num2str(numbersixper)];
t6 = text(x6,20,txt6,'Color','white','FontSize',14);
endfunction 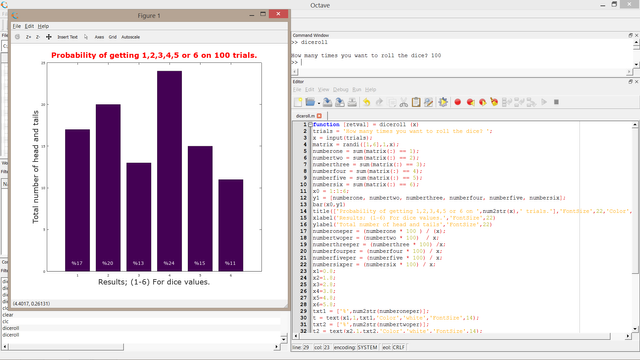
As it can be seen from the above graph for getting one there is 16.5%, for two 15.2%, for three 18.7%, for four 17.7%, for five 15.6%, for six 16.3. The gap between highest probability (getting 3) and lowest one (getting 2) is 3.5% which is actuall quite low compared to 10 and 100 trials where we have around 10 percent difference. It's showing that we are on right way to proove the theoritical 16.67% for each number.
For 10.000 trials
function [retval] = diceroll (x)
trials = 'How many times you want to roll the dice? ';
x = input(trials);
matrix = randi([1,6],1,x);
>numberone = sum(matrix(:) == 1);
numbertwo = sum(matrix(:) == 2);
numberthree = sum(matrix(:) == 3);
numberfour = sum(matrix(:) == 4);
numberfive = sum(matrix(:) == 5);
numbersix = sum(matrix(:) == 6);
x0 = 1:1:6;
y1 = [numberone, numbertwo, numberthree, numberfour, numberfive, numbersix];
bar(x0,y1)
title(['Probability of getting 1,2,3,4,5 or 6 on ',num2str(x),' trials.'],'FontSize',22,'Color','r')
xlabel('Results; (1-6) For dice values.','FontSize',22)
ylabel('Total number of head and tails','FontSize',22)
numberoneper = (numberone * 100 ) / (x);
numbertwoper = (numbertwo * 100)  / x;
numberthreeper = (numberthree * 100) /x;
numberfourper = (numberfour * 100) / x;
numberfiveper = (numberfive * 100) / x;
numbersixper = (numbersix * 100) / x;
x1=0.8;
x2=1.8;
x3=2.8;
x4=3.8;
x5=4.8;
x6=5.8;
txt1 = ['%',num2str(numberoneper)];
t = text(x1,120,txt1,'Color','white','FontSize',14);
txt2 = ['%',num2str(numbertwoper)];
t2 = text(x2,120,txt2,'Color','white','FontSize',14);
txt3 = ['%',num2str(numberthreeper)];
t3 = text(x3,120,txt3,'Color','white','FontSize',14);
txt4 = ['%',num2str(numberfourper)];
t4 = text(x4,120,txt4,'Color','white','FontSize',14);
txt5 = ['%',num2str(numberfiveper)];
t5 = text(x5,120,txt5,'Color','white','FontSize',14);
txt6 = ['%',num2str(numbersixper)];
t6 = text(x6,120,txt6,'Color','white','FontSize',14);
endfunction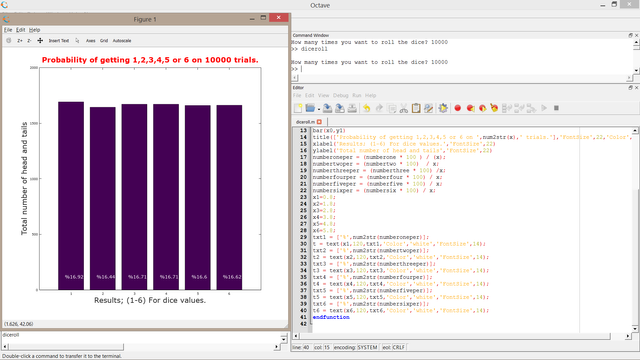
In this case we increased the trials to 10000 ten times greater than the previous one. Thereby the probabilities of getting one, two, three, four, five and six are getting closer to each other and theoritical one. As it can be seen the prob. of getting one is16.92%, for two its 16.44%, for three its 16.71%, for four 16.71%, for four 16.6% and for six its 16.62%. The gap became narrower resulting the diffrence beetween highest probability (getting 1) and lowest probability (getting 2) to 0.48%. By looking these values we can claim that the probability of getting each digit comes close to 1/6 or 1/6*100 percentage the more we repeate the experiment.
Curriculum
- Advanced drawing with Octave
- Two and three dimensional plotting with 'Octave'
- Solve and plot your equations with Octave!
- Coin toss simulation with Monte Carlo method
- Dice rolling simulation with the aid of Octave
Posted on Utopian.io - Rewarding Open Source Contributors
Your contribution cannot be approved because it does not follow the Utopian Rules.
You can contact us on Discord.
[utopian-moderator]
Hello thank you for your feedback. I did add the code blocks however i didnt understand exactly what is 'bad' about formatting. As you can see i used the same format in my previous tutorial (https://utopian.io/u/25430207) and it was approved.