Coin toss simulation with Monte Carlo method
Image source
What Will I Learn?
Greetings, in this tutorial we will focus on the usage of Monte Carlo method to simulate a fair 50% coin toss experiment with the aid of Octave.
- You will learn Monte Carlo method
- Probobility distribution of coin toss
- Function writing in Octave
- Plotting with Octave
Requirements
- Octave 4.2
- Basic knowledge on coding
- Basic knowledge on probablity distribution
- Information about Monte Carlo method
Difficulty
- Intermediate
Tutorial Contents
To begin we must clear what is Monte Carlo method and how we can apply it.
Monte Carlo method: In general it is basically obtaining random values from an experiment. In other words repeating same procedures over and over and calculating its probability.
In this tutorial we will begin with coin toss since in its fair case there are two cases (head and tail) where each has 50% percentage.
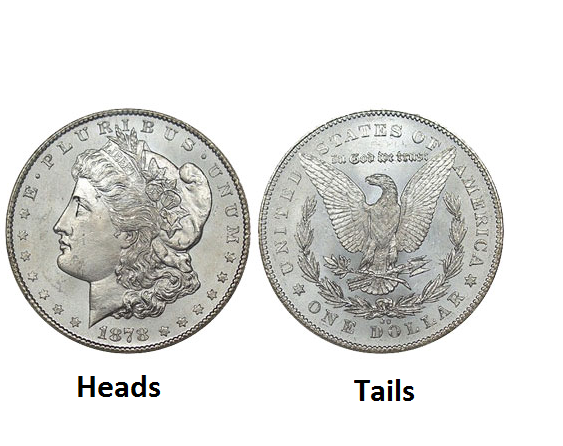
So in each turn we will have 1/2 percentage to get head or tail assuming the experiment is done in fair medium.
To begin our function coding we will first define the function by typing,
function [retval] = cointoss (x)
This above code generate a return value function having two variables xand a name cointoss. Then we need to define x,
The variable x will be the amount of trials or the number of times which the user wants to cointoss. We will define x as trials and trials as an input number,
trials = 'How many times you want to roll? ';
x = input(trials);
Then since we have an amount of trials now we need to get an ouput for each case. For this case the value 0 will represent head and 1 tail. We will use a round function to obtain either 0 or 1 equals to the amount of trials.
matrix = round (rand(1,x));
Later to obtain the amount of head and tails seperately we calculated. To do that we can use a simple matrix summation function that will give the amount of ones in the experiment. Then simply substract these ones to get zeros as follows,
Summation = sum(matrix);
Substraction = x - Summation;
M = [Substraction,Summation];
Then to draw a bar graph use bar function,
bar(M,0.8,'b')
With few labelling and coloring,
title(['Probability of getting head and toss on ',num2str(x),' trials.'],'FontSize',22,'Color','r')
xlabel('Results; (1) For head and (2) For tails.','FontSize',22)
ylabel('Total number of head and tails','FontSize',22)
To have an statistic out of 100 or give a percentage below codes was added,
SubsPer=(100Substraction)/(x)
SumPer=(100Summation)/(x)
Finally to arrange the position and font of these statistics we need to define a location and text function as shown below,
x1=0.8;
x2=1.8;
txt1 = ['%',num2str(SubsPer)];
t = text(x1,1,txt1,'Color','white','FontSize',42);
txt2 = ['%',num2str(SumPer)];
t2 = text(x2,1,txt2,'Color','white','FontSize',42);
Note that the above code, x1 and x2 values can be changed according to get a suitable reading on bar plot. Now to test in several ocasions we first wanted to try it under 10 trials,
For 10 trials
function [retval] = cointoss (x)
trials = 'How many times you want to roll? ';
x = input(trials);
matrix = round (rand(1,x));
Summation = sum(matrix);
Substraction = x - Summation;
M = [Substraction,Summation];
bar(M,0.8,'b')
title(['Probability of getting head and toss on ',num2str(x),' trials.'],'FontSize',22,'Color','r') xlabel('Results; (1) For head and (2) For tails.','FontSize',22)
ylabel('Total number of head and tails','FontSize',22)
SubsPer=(100Substraction)/(x)
SumPer=(100Summation)/(x)
x1=0.8;
x2=1.8;
txt1 = ['%',num2str(SubsPer)];
t = text(x1,1,txt1,'Color','white','FontSize',42);
txt2 = ['%',num2str(SumPer)];
t2 = text(x2,1,txt2,'Color','white','FontSize',42);
endfunction
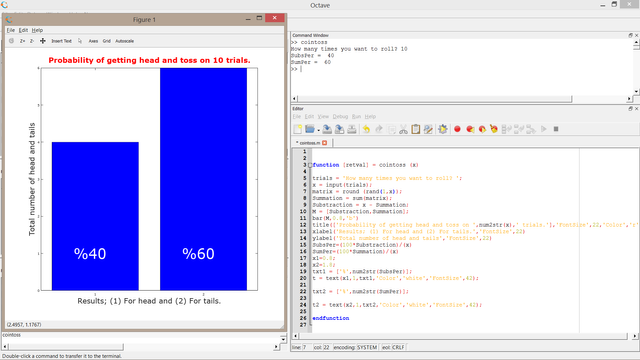
We got 40% head and 60% tails.
For 100 trials
function [retval] = cointoss (x)
trials = 'How many times you want to roll? ';
x = input(trials);
matrix = round (rand(1,x));
Summation = sum(matrix);
Substraction = x - Summation;
M = [Substraction,Summation];
bar(M,0.8,'b')
title(['Probability of getting head and toss on ',num2str(x),' trials.'],'FontSize',22,'Color','r')
xlabel('Results; (1) For head and (2) For tails.','FontSize',22)
ylabel('Total number of head and tails','FontSize',22)
SubsPer=(100Substraction)/(x)
SumPer=(100Summation)/(x)
x1=0.8;
x2=1.8;
txt1 = ['%',num2str(SubsPer)];
t = text(x1,5,txt1,'Color','white','FontSize',42);
txt2 = ['%',num2str(SumPer)];
t2 = text(x2,5,txt2,'Color','white','FontSize',42);
endfunction
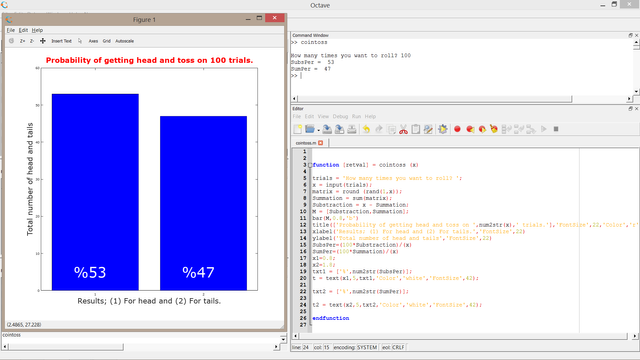
We got 53% head and 47% tails.
For 1000 trials
function [retval] = cointoss (x)
trials = 'How many times you want to roll? ';
x = input(trials);
matrix = round (rand(1,x));
Summation = sum(matrix);
Substraction = x - Summation;
M = [Substraction,Summation];
bar(M,0.8,'b')
title(['Probability of getting head and toss on ',num2str(x),' trials.'],'FontSize',22,'Color','r')
xlabel('Results; (1) For head and (2) For tails.','FontSize',22)
ylabel('Total number of head and tails','FontSize',22)
SubsPer=(100Substraction)/(x)
SumPer=(100Summation)/(x)
x1=0.8;
x2=1.8;
txt1 = ['%',num2str(SubsPer)];
t = text(x1,100,txt1,'Color','white','FontSize',42);
txt2 = ['%',num2str(SumPer)];
t2 = text(x2,100,txt2,'Color','white','FontSize',42);
endfunction
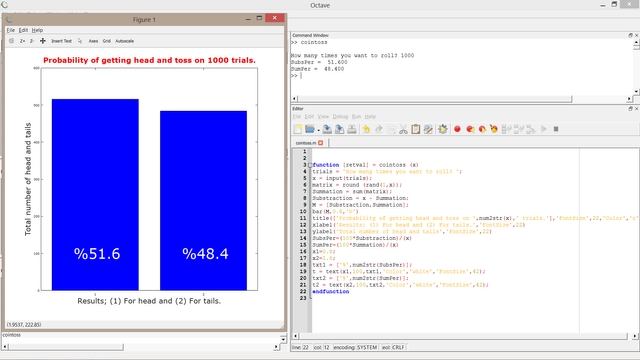
We got 51.6% head and 48.4% tails.
For 10.000 trials
function [retval] = cointoss (x)
trials = 'How many times you want to roll? ';
x = input(trials);
matrix = round (rand(1,x));
Summation = sum(matrix);
Substraction = x - Summation;
M = [Substraction,Summation];
bar(M,0.8,'b')
title(['Probability of getting head and toss on ',num2str(x),' trials.'],'FontSize',22,'Color','r')
xlabel('Results; (1) For head and (2) For tails.','FontSize',22)
ylabel('Total number of head and tails','FontSize',22)
SubsPer=(100Substraction)/(x)
SumPer=(100Summation)/(x)
x1=0.8;
x2=1.8;
txt1 = ['%',num2str(SubsPer)];
t = text(x1,1000,txt1,'Color','white','FontSize',42);
txt2 = ['%',num2str(SumPer)];
t2 = text(x2,1000,txt2,'Color','white','FontSize',42);
endfunction
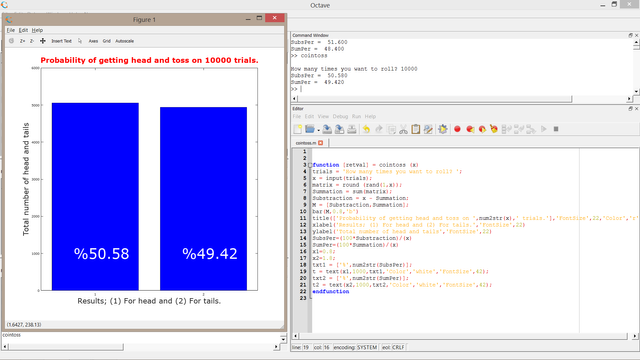
We got 50.58% head and 49.42% tails.
To sum up with the aid of octave and using monte carlo method we can say that the more trials we do the closer percentages will be to 50. Thereby repeating an probability experiment eventually limit the values to the estimated, calculated one.
Curriculum
- Advanced drawing with Octave
- Two and three dimensional plotting with 'Octave'
- Solve and plot your equations with Octave!
Posted on Utopian.io - Rewarding Open Source Contributors

Thank you for the contribution. It has been approved.
You can contact us on Discord.
[utopian-moderator]
Hey @howo, I just gave you a tip for your hard work on moderation. Upvote this comment to support the utopian moderators and increase your future rewards!
Hey @wodsuz I am @utopian-io. I have just upvoted you!
Achievements
Suggestions
Get Noticed!
Community-Driven Witness!
I am the first and only Steem Community-Driven Witness. Participate on Discord. Lets GROW TOGETHER!
Up-vote this comment to grow my power and help Open Source contributions like this one. Want to chat? Join me on Discord https://discord.gg/Pc8HG9x
You can flip a coin online using this website it's better