You are viewing a single comment's thread from:
RE: USING PYTHON AND matplotlib ADD A SECOND GRAPH TO A UI WINDOW: a task request for the open-source project The Amanuensis: Automated Songwriting and Recording
@gustavelebon, yeah Steemit is great, especially Utopian. The payouts are really good for New Feature posts like this.
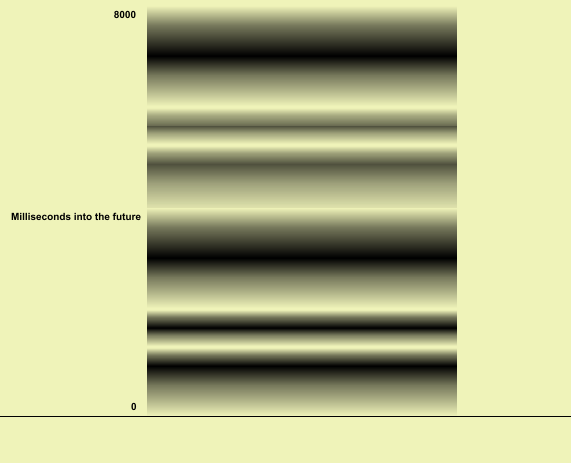
So to avoid latency, I needed to internalize the external Python script I was using and that's why the task has changed. The app is written in Max/MSP which can use JavaScript natively via the jsui object. I can provide you with the right variables and help you connect it up to the rest of the app, but you would be responsible for recreating a "graph" (something like the mockup below) using the Sketch object (OpenGL). There's also something called mgraphics, which would probably work as well. Are you familiar/willing to look into either of those?
Also, do you have a discord? It would probably be easiest to communicate there.
I'll have a look. Find me on Discord: gustavelebon#8927