Introduction to D3.js
D3 is also known as Data-Driven Document, is a useful tools for Visualizing data with HTML, CSS and SVG. The official API reference is at D3 v4.0 API.
To get inspired by the power of d3, you can check out bl.ocks.org, where this website showcase what d3 are capable of doing.
Project Setup
Project setup before we can use it. (If you want to quickly start use method 3)
Method 1: CDN
Quickly setup the web with D3.js CDN in your html
<script src="https://cdnjs.cloudflare.com/ajax/libs/d3/4.12.2/d3.min.js"></script>
Method 2: NPM method
Check out D3 NPM Package. Run npm install d3 --save or yarn add d3
Then, use import statement with import * as d3 from "d3";
Method 3: Codepen or BlockBuilder
This is the easiest way to get started.
Builder of D3
Based on bl.ocks.org, blockbuilder allows you to "fork" the bl.ocks and get started online.
Codepen
I am going to stick back to codepen as my favourite online editor.
Part 01: Getting Started
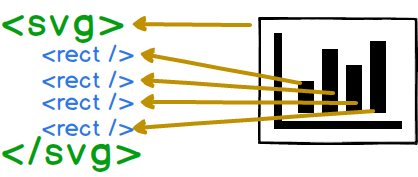
In the html, create a svg with rect in it.
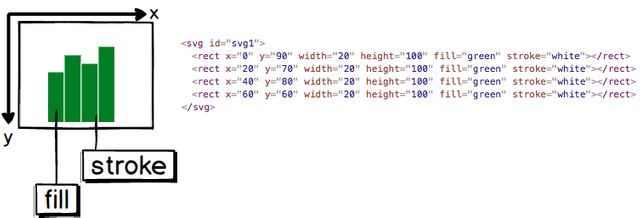
<svg id="svg1">
  <rect></rect>
  <rect></rect>
  <rect></rect>
  <rect></rect>
</svg>
In this example, we set the fix amount of rectangle.

Each rect is map to individual bar of the chart, and svg is the container.
const data1 = [10, 30, 20, 40];
const width1 = 20;
const height1 = 100;
d3.select('#svg1')
  .selectAll('rect')
  .data(data1)
  .attr('x', (d, i) => i * width1)
  .attr('y', d => height1 - d)
  .attr('width', width1)
  .attr('height', height1)
  .attr('fill', 'green')
  .attr('stroke', 'white');
data1indicate the data entry;width1is the width of each rect;height1is the height of each rect;d3.select('#svg1')select (like querySelector) the id svg1.selectAll('rect')select all rect elements that exist in svg.data(data1)bind data1 to the selector.attr('x', (d, i) => i * width1)set width of each rect (fixed)..attr('y', d => height1 - d)set the height of each rect. (Will be explained).attr('fill', 'green')set the table to be green.attr('stroke', 'white')set the divide color between rect
D3 selection can be selectAll and select method. This selection method is selecting the element in DOM.
d3.select for single element
d3.selectAll for multiple elements
both method can use css selector
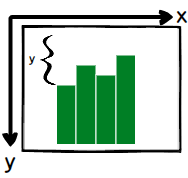
Since D3 y-axis goes downwards, to achieve a vertical graph, we use the height, height1 to minus the current value;
Part 02: Improvement from Part 1
Since declaring rect statically is not that flexible for larger app, in d3.js, we can create rect in svg.
in html,
<svg class="svg3"></svg>
in js file,
const data2 = [10, 30, 20, 40];
const width2 = 20;
const height2 = 100;
d3.select('#svg2')
  .selectAll('rect')
  .data(data2)
  .enter().append('rect')
  .attr('x', (d, i) => i * width2)
  .attr('y', d => height2 - d)
  .attr('width', width2)
  .attr('height', height2)
  .attr('fill', 'red')
  .attr('stroke', 'grey');
First, we select with select('#svg2').
Same as previous, we choose all the rect in the svg
Then, enter().append('rect') state that went enter() happen, it will append a new rect
This means that rect will be genearated when needed.
Posted on Utopian.io - Rewarding Open Source Contributors


Thank you for the contribution. It has been approved.
You can contact us on Discord.
[utopian-moderator]
Hey @superoo7 I am @utopian-io. I have just upvoted you!
Achievements
Suggestions
Get Noticed!
Community-Driven Witness!
I am the first and only Steem Community-Driven Witness. Participate on Discord. Lets GROW TOGETHER!
Up-vote this comment to grow my power and help Open Source contributions like this one. Want to chat? Join me on Discord https://discord.gg/Pc8HG9x