Part 27: Analysing The Amount Of Transactions On The STEEM Blockchain In Parallel

This tutorial is part of a series where different aspects of programming with steem-python are explained. Links to the other tutorials can be found in the curriculum section below. This part will explain how to perform a multi threaded block analysis of the STEEM Blockchain with a MySQL database.
Repository
https://github.com/steemit/steem-python
What will I learn
- Store data in parallel
- MySQL blocking
- Reduce RAM consumption
- Plotting data
Requirements
- Python3.6
steem-python- MySQL
- PHPMyAdmin
- Matplotlib
Difficulty
- intermediate
Tutorial
Preface
The tutorial builds on the previous two tutorials: Part 21: Use Multi Threading To Analyse The Steem Blockchain In Parallel and Part 26: Retrieving Data From The STEEM Blockchain And Storing Into A MySQL Database.
STEEM has a block time of 3 seconds, that means that every day 28 800 new blocks are created. Analysing those in serial will take a long time. A better way to do so would be in parallel. Doing so will drastically improve performance but also introduce new problems which will be discussed in this tutorial.
This tutorial will show how to analyse a large amount of blocks and count the amount of transactions occurring per minute, per hour and per day. Storing all the data in a database and plotting the data afterwards.
Setup
Download the files from Github. There 3 are files analysis.py which is the main file, database.py which contains the interactions with the MySQL database and plot.py which is used to plot the generated data. analysis.py takes two arguments that set the amount_of_blocks and thread_amount. It is important that the amount_of_blocks is an even multiple of the thread_amount. plot.py takes one argument which sets the date to plot the data for.
Run scripts as following:
> python analysis.py 65536 16
> python plot.py 2018-07-06
Configure the database
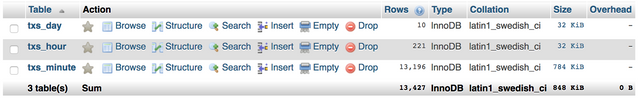
The code is set up to store the data in a database steem with 3 different tables: txs_minute, txs_hour and txs_day. Also a user test with the password Test!234# is used. Executing the code below will set everything up in the same manner. If you wish to use your own settings make sure to make the appropriate changes in database.py.
Login as the root user:
mysql -u root -p
Create a test account, this account is used in the code:
GRANT ALL PRIVILEGES ON *.* TO 'test'@'localhost' IDENTIFIED BY 'Test!234#';
Create a new database called steem:
CREATE DATABASE steem;
Create the tables for storing the data:
CREATE TABLE `steem`.`txs_minute` ( `id` INT NOT NULL AUTO_INCREMENT , `date` DATETIME NOT NULL , `amount` INT NOT NULL , PRIMARY KEY (`id`), UNIQUE (`date`)) ENGINE = InnoDB;

CREATE TABLE `steem`.`txs_hour` ( `id` INT NOT NULL AUTO_INCREMENT , `date` DATETIME NOT NULL , `amount` INT NOT NULL , PRIMARY KEY (`id`), UNIQUE (`date`)) ENGINE = InnoDB;

CREATE TABLE `steem`.`txs_day` ( `id` INT NOT NULL AUTO_INCREMENT , `date` DATETIME NOT NULL , `amount` INT NOT NULL , PRIMARY KEY (`id`), UNIQUE (`date`)) ENGINE = InnoDB;
Exit mysql:
\q
Store data in parallel
The amount of transactions for a given date, hour and minute will be stored in 3 different tables. This allows for different resolutions for performing analysis after. The timestamp is used as the unique key value in a dict with a frequency counter. All of this information is taken from the timestamp that is located inside each block and converted to a datetime_object.
timestamp = block['timestamp']
datetime_object = datetime.strptime(timestamp, '%Y-%m-%dT%H:%M:%S')

for operation in block['transactions']:
    hour = datetime_object.hour
    minute = datetime_object.minute

    self.process_transaction(f'{hour}:{minute}:00', self.data_minute)
    self.process_transaction(f'{hour}:00:00', self.data_hour)
    self.process_transaction(f'00:00:00', self.data_day)
The way the parallelisation works in this code is that all the blocks that are to be analysed are divided evenly among all of threads. This means that several threads can be working on the same unique key. For example the same date.
def process_transaction(self, string, data):
    key = str(self.date) + ' ' + string
    if string in data:
        data[key] += 1
    else:
        data[key] = 1
When storing the data from memory to the database multiple threads may want to add the same unique key to the table. To prevent this, first a check has to be done to see if the key is already in the the table. If so the record must be updated instead of inserted.
if self.check_if_record_exist(date, table):
    update_record(amount, date, table)
else:
    insert_record(amount, date, table)
MySQL blocking
Now imagine two threads accessing the database at the same time. Thread 1 and thread 2 both check to see if the date 2018-07-06 is already in the database. Now if one of threads looked in the database just before the other thread did an insert or update it would see the old data. It would then precede to use to old data to update the record. Omitting the work of the previous thread. This can be prevented by locking the table.
cursor.execute(f"LOCK TABLES {table} WRITE;")
By locking the table any other thread is unable to perform any writing actions. By having each thread acquire their own lock first they will not be able to make any reading actions as well. Python gracefully deals with this situation by waiting until the lock is released.
cursor.execute("UNLOCK TABLES;")
Reduce RAM consumption
When performing large scale analysis on the blockchain the amount of RAM usage can increase significantly. Reducing RAM usage while also keeping performance in mind is therefor important. Depending on the type of analysis being done it is recommended to clear the data buffers regularly, but not to often to reduce overhead. With 28 800 blocks per day, 1 week would be 201 600 blocks and 4 weeks 806 400 blocks. At the time of writing each block contains about 50 transactions. The amount of operations adds up quickly, especially when storing more variables.
For this tutorial every hour of blocks analysed each thread inserts the data into the database and clears its buffers. Doing so also spreads out interaction with the database so that threads will be less likely to have to wait on each other.
if datetime_object.hour != self.hour:
    self.dump_data()
    self.data_hour = {}
    self.data_minute = {}
    self.data_day = {}
    self.hour = datetime_object.hour
Plotting data
pyplot which is part of matplotlib is very useful tool for plotting graphs. In the case of plotting the data for the amount of transactions per hour for a given date the query would be as follows. BETWEEN allows for a specific date range to set.
query = (f"SELECT `date`,`amount` FROM `{table}` WHERE `date` " +
         f"BETWEEN '{start_date}' AND '{end_date}' " +
         "ORDER BY `date` ASC;")
datetime can be used with timedelta to calculate the end_date from a start_date that looks like %Y-%m-%d as follows:
start_date = datetime.strptime(date, '%Y-%m-%d').date()
end_date = start_date + timedelta(days=1)
The x and y values for the graph are fetched from the database and put into separate lists. x will be used to plot the times while y plot the amount of transactions.
x, y = db.get_data(start_date, 'txs_hour')

for result in self.cur.fetchall():
        x.append(result[0])
        y.append(result[1])

return x, y
The values are then plotted using pyplot. Labels are added for the x and y axis. Finally a grid is added and tight_layout() is called so that everything fits on the generated graph.
plt.plot(x, y)
plt.xlabel('time in [UTC]')
plt.ylabel('transactions/hour')
plt.tight_layout()
plt.grid()
The x values are datetime objects. Dates from matplotlib is used to process these values. major_locator sets the x values to display on the graph, for which hours will be used. For formatting %H:%M is used to omit the date and the seconds. xlim() sets the start and end values for the x asis and xtick(rotation=45) rotates the x labels so they stay readable.
hours = mdates.HourLocator()
t_fmt = mdates.DateFormatter('%H:%M')
plt.gca().xaxis.set_major_locator(hours)
plt.gca().xaxis.set_major_formatter(t_fmt)
plt.xlim([x[0], x[len(x)-1]])
plt.xticks(rotation=45)
Running the script
Running analysis.py with the arguments number_of_blocks and number_of_threads will start analysing the number of blocks starting from current head_block - number_of_blocks. It will then store the amount of transactions occurring in all of the blocks for each minute, hour and day. Depending on the amount of blocks being analysed this may still take a while.
> python analysis.py 262144 16
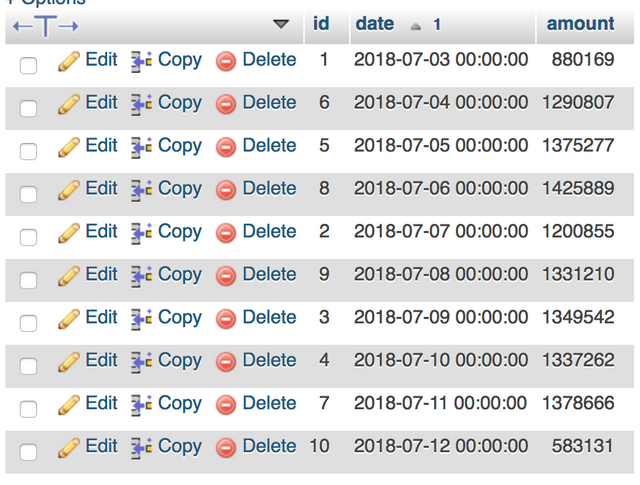
Took at least half an hour and resulted in the following table for days:
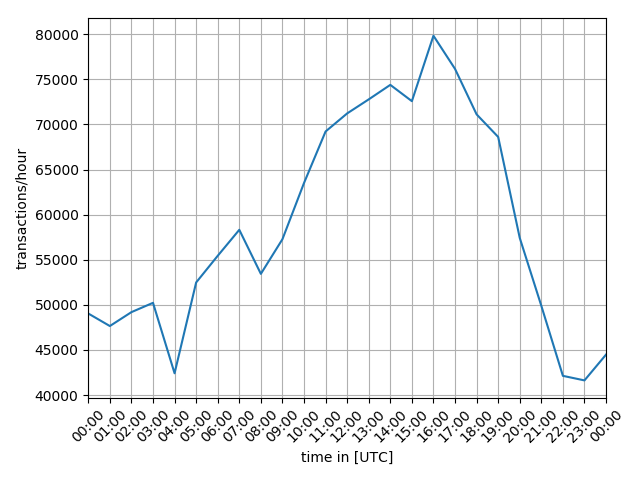
Having a closer look running plot.py for the date 2018-07-06 then returned the following graph:
> python plot.py 2018-07-06
Curriculum
Set up:
- Part 0: How To Install Steem-python, The Official Steem Library For Python
- Part 21: Use Multi Threading To Analyse The Steem Blockchain In Parallel
- Part 26: Retrieving Data From The STEEM Blockchain And Storing Into A MySQL Database
The code for this tutorial can be found on GitHub!
This tutorial was written by @juliank.
Hey @steempytutorials
Thanks for contributing on Utopian.
We’re already looking forward to your next contribution!
Want to chat? Join us on Discord https://discord.gg/h52nFrV.
Vote for Utopian Witness!
Thank you for your contribution.
Your contribution has been evaluated according to Utopian policies and guidelines, as well as a predefined set of questions pertaining to the category.
To view those questions and the relevant answers related to your post, click here.
Need help? Write a ticket on https://support.utopian.io/.
Chat with us on Discord.
[utopian-moderator]