Steemit Business Intelligence: Video Format Posts Analysis
Details
Vloggers were posting videos in Steemit through YouTube and Vimeo links before DTube and DLive were launched in the Steem blockchain. The analyst wanted to see if the two dApps are changing behaviors around the way videos are being shared in the Steem blockchain.
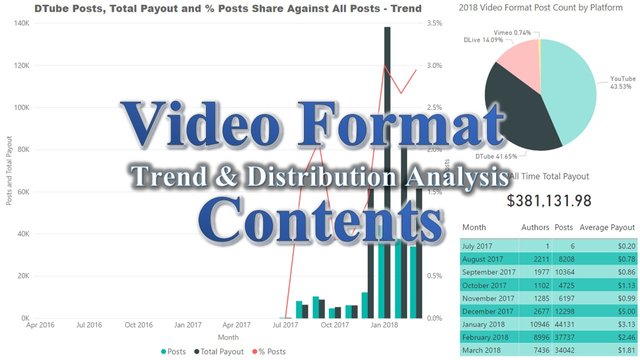
This is the description of Dtube taken from their website:
D.Tube is the first crypto-decentralized video platform, built on top of the STEEM Blockchain and the IPFS peer-to-peer network.
D.Tube aims to become an alternative to YouTube that allows you to watch or upload videos on IPFS and share or comment about it on the immutable STEEM Blockchain, while earning cryptocurrency doing it.
While DLive is described in this post as:
DLive is the first decentralized video live streaming platform on Steem! It can be seen as the Twitch on the Steem blockchain including, but not limited to, gaming contents.
While the two dApps intended to cater to different sets of users, this would have meant taking some of the share of video format posts previously being done through YouTube.
Outline
To show the change in posting video format contents, the analyst will look at these data-points:
- 24 Months Trend of Video Format Content (Share) Between YouTube, Vimeo, DTube & DLive
- 24 Months Trend of Author Count, Post Count, & Total Payout Value for Posts with a YouTube Video
- 9 Months Trend of Author Count, Post Count, & Total Payout Value for Posts Created in DTube
- 5 Months Trend of Author Count, Post Count, & Total Payout Value for Posts Created in DLive
- Top 25 Authors Sorted by Payout Value for Contents with YouTube Video/s, Posts Created in DTube, & Posts Created in DLive
Scope of Analysis
This analysis will look at the changes brought by the creation of DTube and DLive to the behavior around posting video format contents in Steemit. The analyst only took the data sets where posts contain YouTube links, Vimeo links, created in DTube, and created in DLive.
The data used in this analysis were captured between 12NN to 2PM GMT of March 28, 2018.
The analyst tried to capture all data available to build trends, but had to limit the top users for each platforms to the data available for the year 2018 so far because of two reasons; one is because DLive was created only in October 2017, and taking this kind of data from inception will take unnecessary bandwidth of the database the analyst used.
Tools
The analyst used arcange's Steem SQL Database to obtain the data related to count of posts, payout value, and distinct author count using the Comments table. A variation of these queries were used:
/*Data for All Posts Per Month*/
SELECT
    YEAR(Comments.created) AS [YEAR],
    MONTH(Comments.created) AS [MONTH],
    Count(Comments.author) AS [Posts],
    Count(distinct Comments.author) AS [DistinctCommentAuthor],
    Sum(Comments.total_payout_value) AS [TotalPayout],
    Sum(Comments.pending_payout_value) AS [PendingPayout]
FROM
    Comments (NOLOCK)
WHERE
    YEAR(Comments.created) = 2017 AND
    depth = 0
GROUP BY
    YEAR(Comments.created),
    MONTH(Comments.created)
/*Data for Posts with YouTube and Vimeo Links Per Month*/
SELECT
    YEAR(Comments.created) AS [YEAR],
    MONTH(Comments.created) AS [MONTH],
    Count(Comments.author) AS [Posts],
    Count(distinct Comments.author) AS [DistinctCommentAuthor],
    Sum(Comments.total_payout_value) AS [TotalPayout],
    Sum(Comments.pending_payout_value) AS [PendingPayout]
FROM
    Comments (NOLOCK)
WHERE
    YEAR(Comments.created) = '2018' AND
    depth = 0 AND
    CONTAINS(body, 'https://youtu.be')
GROUP BY
    YEAR(Comments.created),
    MONTH(Comments.created)
*** Note: The year in the operator WHERE was changed to 2016 and 2018 to get the data for the months in those years.
*** Note: To get the data for posts with Vimeo links, the link 'https://youtu.be' in the operator WHERE was changed to 'https://vimeo.com/'.
/*Data for Posts Created in DTube and DLive Per Month*/
SELECT
    YEAR(Comments.created) AS [YEAR],
    MONTH(Comments.created) AS [MONTH],
    Count(Comments.author) AS [Posts],
    Count(distinct Comments.author) AS [DistinctCommentAuthor],
    Sum(Comments.total_payout_value) AS [TotalPayout],
    Sum(Comments.pending_payout_value) AS [PendingPayout]
FROM
    Comments (NOLOCK)
WHERE
    YEAR(Comments.created) = 2017 AND
    Month(Comments.created) = 7 AND
    depth = 0 AND
    IIF(isjson(comments.json_metadata) = 1, IIF(CHARINDEX('/', json_value(comments.json_metadata, '$.app')) > 0, SUBSTRING(json_value(comments.json_metadata, '$.app'), 1, CHARINDEX('/', json_value(comments.json_metadata, '$.app'))-1),json_value(comments.json_metadata, '$.app')), null) = 'dtube'
GROUP BY
    YEAR(Comments.created),
    MONTH(Comments.created)
*** Note: The app 'dtube' in the operator WHERE was changed to 'dlive' to get the data for posts created in DLive.
/*Data for Top Authors Per Platform*/
SELECT
    Comments.author,
    YEAR(Comments.created) AS [YEAR],
    Count(Comments.author) AS [Posts],
    Sum(Comments.total_payout_value) AS [TotalPayout],
    Sum(Comments.pending_payout_value) AS [PendingPayout]
FROM
    Comments (NOLOCK)
WHERE
    YEAR(Comments.created) = 2018 AND
    depth = 0 AND
    IIF(isjson(comments.json_metadata) = 1, IIF(CHARINDEX('/', json_value(comments.json_metadata, '$.app')) > 0, SUBSTRING(json_value(comments.json_metadata, '$.app'), 1, CHARINDEX('/', json_value(comments.json_metadata, '$.app'))-1),json_value(comments.json_metadata, '$.app')), null) = 'dtube'
GROUP BY
    YEAR(Comments.created),
    Comments.author
The data from the Steem SQL were extracted to a Microsoft Excel spreadsheet, and the charts were created in Microsoft Power BI.
Results
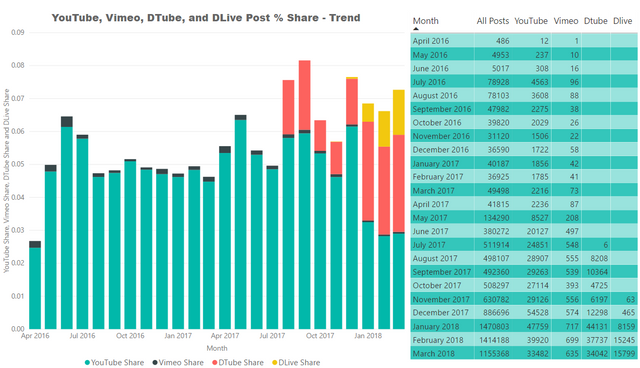
As seen in this chart, the share of video format posts against the overall post haven't really changed much. A growing percentage of the video format posts however, can be seen to be moving to DTube and DLive. Some spikes in the video format posts can be observed in:
- August and September 2017 when the creation of Dtube brought excitement to the community.
- December 2017 post the creation of DLive in November 2017.
- Sustained higher percentage of video format posts with growing share created via DTube and DLive after the delegation both DTube and Dlive received from Steemit Inc.
Trend of Posts With Video Link from YouTube
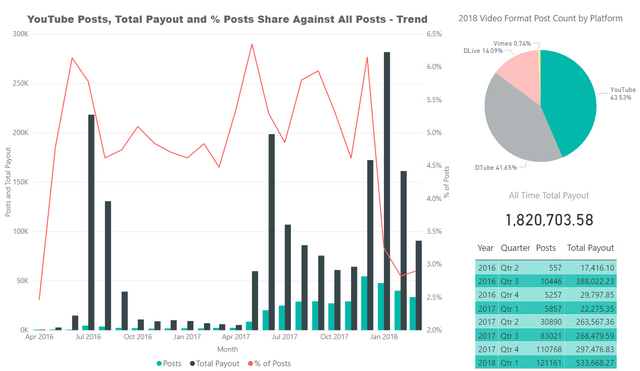
Until the creation of DTube in July 2017 and DLive in November 2017, the video format posts were done via linking a video in YouTube. As shown in the chart, the share of posts with YouTube links have not been really disrupted until January 2018 when it took a significant dip from greater the 6% in December 2017 to just a little over 3% in January 2018. The share of posts with YouTube links have since stayed between 3-3.5%.
Trend of Posts Created in DTube
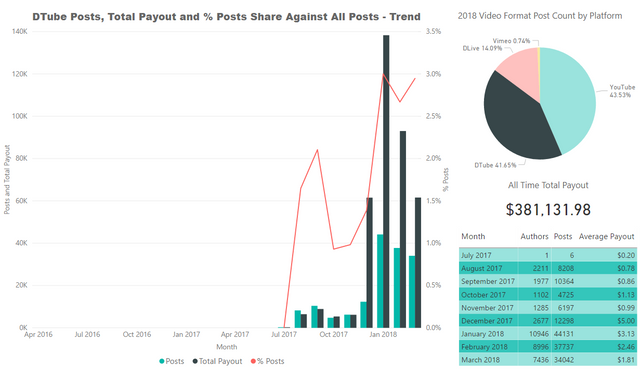
The analyst took the time to scale the posting activities against the overall count of posts in Steemit and all other dApps. In another contribution, the analyst studied the Price & (Voting, Posting, & Commenting) Behavior Correlation. While it can be observed that there is a drop in the count of posts between January to March 2018, the same drop is happening system-wide. In terms of share however, DTube is in general uptrend, quickly picking up in popularity and taking the share from posts with YouTube links as shown in the pie chart.
Trend of Posts Created in DLive
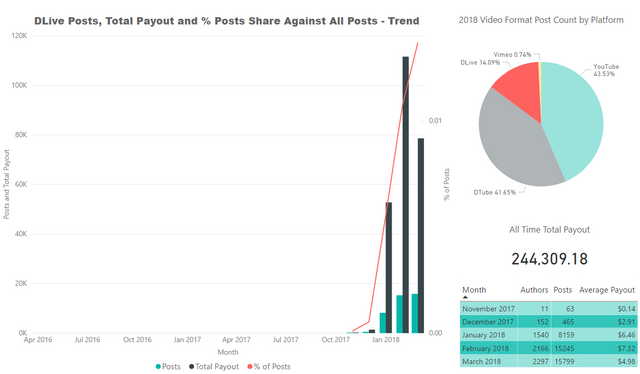
While fairly new, DLive has also been in a good trend trajectory especially since January 2018 post getting greater than 2,000,000 Steem Power delegation from mistergelegation.
Top Authors of Video Format Contents By Platform
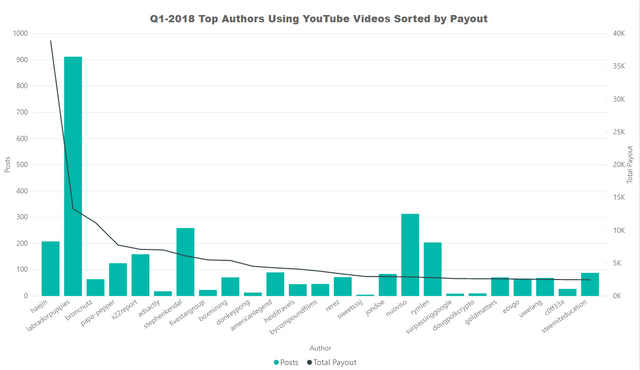
- Author haejin is shown as the top most author using YouTube links and posting in DTube. He is known to be supported by ranchorelaxo with his 1,300,000++ Steem Power.
- Author boxmining also showed up in both the lists of top authors using YouTube links and posting in DTube. boxmining is a crypto vlogger posting quite regularly between 2-4 posts a day.
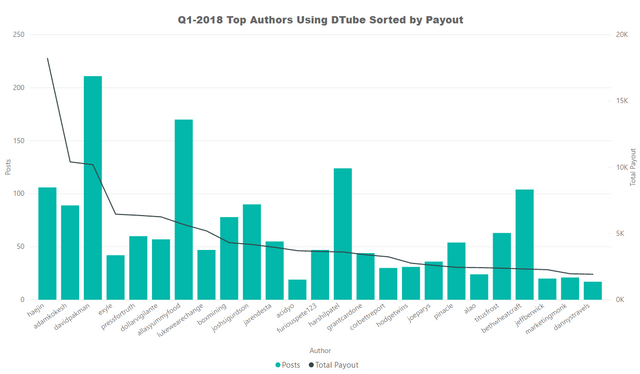
The authors between haejin and boxmining in the top author list of DTube are known vloggers, they regulary posts videos on different subjects.
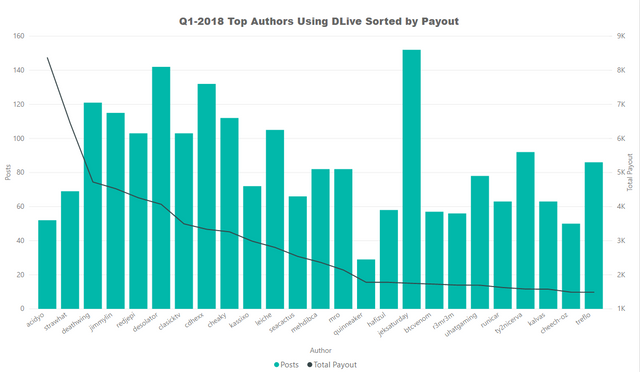
acidyo is at the top of the list of DLive users, he is a know manual curator and the creator of OCD. In Dlive he is posting game streaming videos. With his greater than 400,000 Steem Power (own+delegated), consistent support from kpine and pretty consistent upvotes from dlive got him at the top of this list, aside from his popularity as an early adopter, awesome contents, and support for many communities through his curation efforts.
acidyo is the only overlap between DTube and Dlive. Which tells us that the two dApps are catering to different sets of users/interests.
Overlaps (Use of DTube/DLive & YouTube Video Links
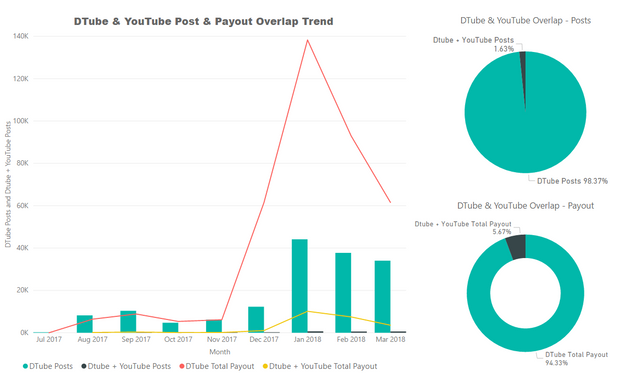
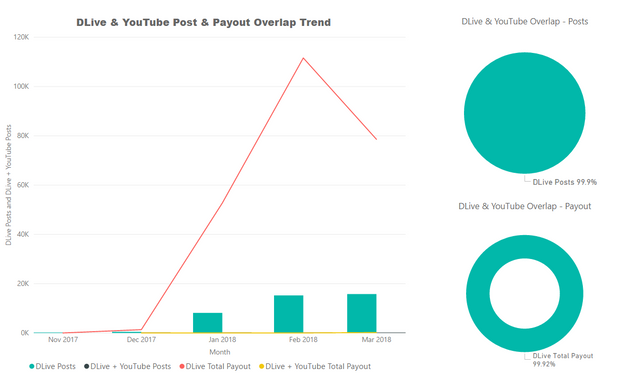
Because of the few overlaps seen in the list of the top users, the analyst wanted to understand the overlap created by posting through DTube and DLive, then using a YouTube video link in their posts. As shown in these charts, the overlap is very minimal and is unlikely to be skewing the data.
Conclusion
The analyst have no personal experience in using DTube and Dlive, but can clearly see why Steemians are moving to these platforms. First is the censorship and demonetization in YouTube, then the potential bigger rewards on post because of the delegation received by both DTube and DLive, and the adoption of the public and decentralized nature of dApps in general.
The trend lines suggest that the adoption of both DTube and DLive at these very early stages are growing. The analyst speculates that as more and more Steemians and non-Steemians currently still in YouTube get educated on the use of the dApps in this study, the growth in usage will grow exponentially benefiting both the dApps and the Steemit as a whole.
Posted on Utopian.io - Rewarding Open Source Contributors
Hey @steemitph I am @utopian-io. I have just upvoted you!
Achievements
Community-Driven Witness!
I am the first and only Steem Community-Driven Witness. Participate on Discord. Lets GROW TOGETHER!
Up-vote this comment to grow my power and help Open Source contributions like this one. Want to chat? Join me on Discord https://discord.gg/Pc8HG9x
Thank you for the contribution. It has been approved.
I like the first chart where shares per platform changed per month. I think it would have been better if the time of delegation was also included in the visual - perhaps another bar chart below it showing amount of SP each account had.
Also, I also think it would help the reader (me too personally) of what you meam by the term overlap - an author using both platforms that were included in the top authors?
Overall, a very professional analysis.
You can contact us on Discord.
[utopian-moderator]
Thanks East, great suggestions. Will keep these in mind for future contributions. The overlap is overall data. That includes posts made in either DTube and DLive, but are also have YouTube video/s in the post. About the top authors who showed up in more than one platform, I could have simply said it that way.
Thanks for reviewing my work and the compliment towards the end.
Wow! As in wow! I am using Dtube but I think Dlive is better than Dtube? I'm not sure...
will be great
one day ok
Excellent detailed post! New here. Will def check out DTube. Thanks much :-)