Steemit Business Intelligence: SBD, Steem, & SP Payout in Relation with Market Movement
Details
The analyst made a contribution three months ago about How SBD Price Movement is Changing Payout Preference. Having joined the platform towards the end of July, the analyst have not experienced getting liquid Steem in payout until very recently, and wanted to understand the variables that trigger the change in payout.
The analyst's research led to this Steem Master Code in GitHub, where he found this code:
         if( percent_sbd <= STEEM_SBD_START_PERCENT )
            dgp.sbd_print_rate = STEEM_100_PERCENT;
         else if( percent_sbd >= STEEM_SBD_STOP_PERCENT )
            dgp.sbd_print_rate = 0;
         else
            dgp.sbd_print_rate = ( ( STEEM_SBD_STOP_PERCENT - percent_sbd ) * STEEM_100_PERCENT ) / ( STEEM_SBD_STOP_PERCENT - STEEM_SBD_START_PERCENT );
In an easier to understand formula this means:
If percent_sbd is < 2% then the sbd_print_rate is 100%
If percent_sbd is > 5% then it stops printing sbd
If percent_sbd is between 2% and 5% then sbd_print_rate = 100% * (5% - percent_sbd)/3%
In today's scenario where the blokchain explorer SteemD shows these values:
| Steem Supply | SBD Supply | Price | SBD in Steem | Percent SBD |
|---|---|---|---|---|
| 271059110 | 10983942 | 2.115 | 5193353 | 1.92% |
***sbd_print_rate is 100%
3 days ago however, the values were:
| Steem Supply | SBD Supply | Price | SBD in Steem | Percent SBD |
|---|---|---|---|---|
| 265700335 | 10858145 | 1.855 | 5853447 | 2.15% |
***In this case sbd_print_rate is 95%: (5%-2.15%)/3% = 95%
In connection with the recent Steem payout between the 18th to the 21st of March 2018, the analyst wanted to understand the trend, and distribution of payout from inception in relation with market related data like prices and market capitalization.

Outline
To show the relationship between prices and market capitalization and the payout distribution, the analyst will look at the following data-points:
- 21 Months Distribution Trend Between Steem Dollar, Steem Power & Steem Payout
- Payout Distribution in Relation with Price Movement
- Payout Distribution in Relation with Market Cap % of SBD
Scope of Analysis
This analysis will explore the relationship of price movements and market capitalization of Steem Dollars and Steem, and the distribution of payout between Steem Dollars, Steem Power, and liquid Steem. The data captured was from July 18 which was the first date with recorded Steem Dollar price using CoinMarketCap. The data-points related to prices, market cap, and payout were all captured at 12NN GMT of March 23, 2018.
While this analysis was a result of the analyst's curiosity about the trigger of liquid Steem payout, it will not look at the variables involved in that trigger. The analyst will look at external market movements rather than the price feed and SBD percentage.
Tools
The analyst used arcange's Steem SQL Database to obtain the data related to the payout distribution using the VOAuthorRewards table. A variation of this query were used to generate the data:
SELECT
    YEAR(VOAuthorRewards.timestamp) AS [YEAR],
    MONTH(VOAuthorRewards.timestamp) AS [MONTH],
    DAY(VOAuthorRewards.timestamp) AS [DAY],
    Count(VOAuthorRewards.steem_payout) AS [COUNT],
    Sum(VOAuthorRewards.steem_payout) AS [Steem],
    Sum(VOAuthorRewards.sdb_payout) AS [SBD],
    Sum(VOAuthorRewards.vesting_payout) AS [Vest]
FROM
    VOAuthorRewards (NOLOCK)
GROUP BY
    YEAR(VOAuthorRewards.timestamp),
    MONTH(VOAuthorRewards.timestamp),
    DAY(VOAuthorRewards.timestamp)
*A delimiter WHERE VOAuthorRewards.steem_payout > 0 was added to capture the count of incidents of Steem Payout.
**DAY(VOAuthorRewards.timestamp) AS [DAY] was removed to get the monthly data.
***vesting_payout was converted to Steem Power using the Vest Calculator
The data related to prices and market capitalization were capture form the historical data feature of CoinMarketCap. The data from Steem SQL and CoinMarketCap were both plotted in Microsoft Excel for processing, and the charts were built using Microsoft Power BI.
Results

In the charts above the payout in liquid Steem when looked at for the entire history of the platform is kept to very minimal. In incident it is only 3.5% and in distribution it is only 5.2%. Please note that the analyst took these values as equals and did not scale anything based on prices. The intent of this analysis is to show the distribution of rewards in units and not fiat currency equivalents.
In the alternate view below, the analyst noted that the longest duration of liquid Steem was seen between September 2016 and April 2017. The worst Steem Dollar payout was recorded in November 2016 at 0.31% share, when the payouts were almost completely distributed between liquid Steem (40.19%) and Steem Power (59.50%) .
There is a shift in distribution of payout from May 2017 when the liquid Steem payout went away, then almost equal distribution taking the average of June to November 2017, then a significant shift to >75% Steem Dollar payout at the average between December 2017 to February 2018, followed by reappearance of liquid Steem payout in March 2018.

Payout Distribution & Prices

In this chart we can see that when the price of Steem is under a dollar, the payout of Steem Power is dominant. In December 2016 for example when the average price of Steem Dollar was $1 and Steem was $0.18 (a ratio of 5.7 Steem:1 Steem Dollar), the Steem Payout took 77% share, this would have been slightly less than that if not of the liquid Steem payout (we will touch on this in the next charts).
Between June and November 2017 when the price of Steem and Steem Dollar were both near $1, the distribution of payout between Steem Dollar and Steem Power was almost equal.
When the prices of Steem Dollar moved significantly above $1 from December 2017 to February 2018, the payout distribution moved to an average of >75% Steem Dollar for those three months.
There are plenty of materials available in the platform that explains the payout calculation in relation with the prices, and the analyst don't see a really need to repeat those as part of this analysis. There is this Reward Calulator from dragosroua which may be a great way to further understand the payout in relation with prices of Steem and Steem Dollar.
The chart below is a more granular view of daily level data presented in monthly view above.

Payout Distribution & SBD Market Cap/Steem Market Cap
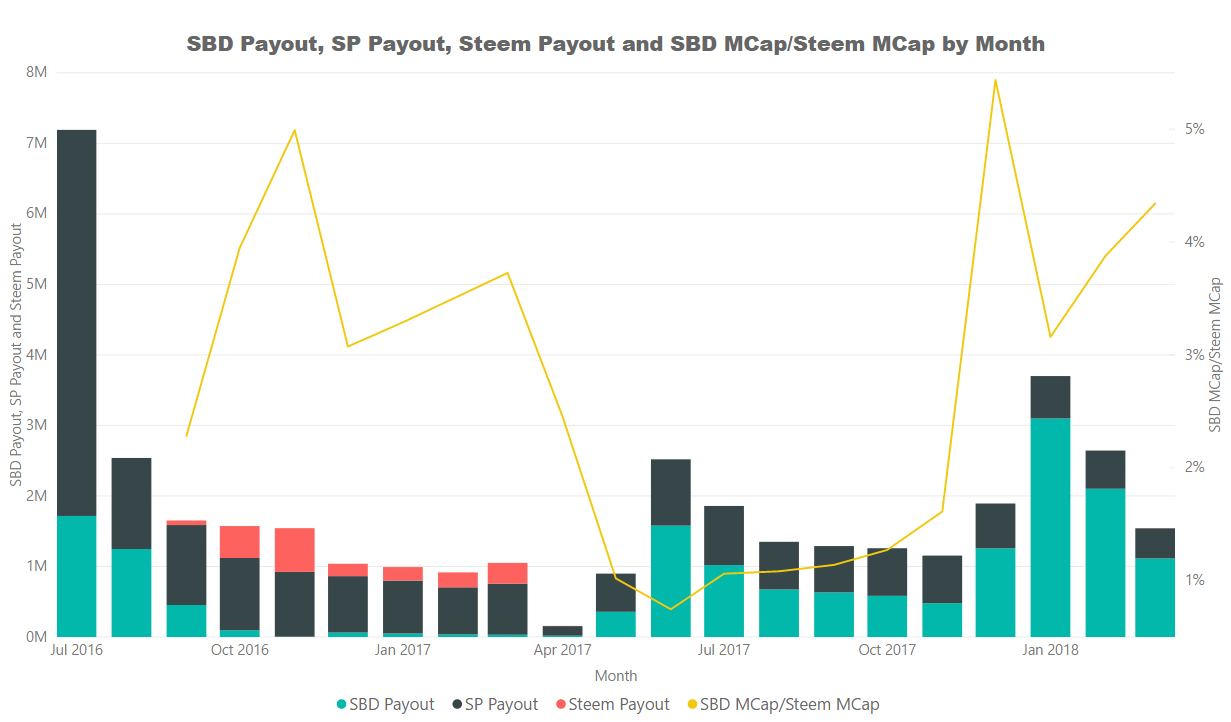
The analyst started with this contribution with the Steem Master Code in GitHub to avoid confusing the readers between the data being presented in this study and the actual triggers in changing the payout distribution. In these two charts we can see that between September 2016 to April 2017 when the Steem Dollar Market Cap was more than 2% of Steem Market Cap, the printing rate of Steem Dollar was less than 100%. In fact in November 2016, less than half a percentage of Steem Dollars were printed when Steem Dollar Market Cap was averaging above 5% of the Steem Market Cap.
The Steem Dollar Market Cap stayed less than 2% since May 2017 to November 2017, until we saw a pump in Steem Dollar price in December. The printing of Steem Dollar did not change between December 2017 and February 2018 precisely because the code is not based on external market, but as discussed at the beginning of this contribution. Still, the analyst think that while the market is moving the way it is now where the debt ratio is very near the 2% trigger, Steem Dollar printing is likely to reduce, and liquid Steem payout is likely to reappear.

Conclusion
Seeing minimal occurrences and share of liquid Steem payout tells us that the current cap and triggers are working to keep the debt ratio within control. This analysis also highlights the advantage of those who joined earlier than June 2017 in accumulating Steem Power if they kept the SP and did not powered down.
The analyst have posted his views about how Steem is more like a marathon than a sprint, although he acknowledges that there is still so much more to learn about how the whole platform works. With the current movement of the market, the rewards are likely to take a hit in favor of keeping the ecosystem around the currencies in check, the debt ratio minimal, and the supposed peg of Steem Dollar near $1. This Are You Really Playing The Steem Long Game? blog post from dragosroua is a great reading material on the subject of rewards in the short and long term.
Posted on Utopian.io - Rewarding Open Source Contributors
Thank you for the contribution. It has been approved.
You can contact us on Discord.
[utopian-moderator]
Hey @crokkon, I just gave you a tip for your hard work on moderation. Upvote this comment to support the utopian moderators and increase your future rewards!
The steem price is correlated to the BTC so it is just a waiting game for now.
Hey @steemitph I am @utopian-io. I have just upvoted you!
Achievements
Community-Driven Witness!
I am the first and only Steem Community-Driven Witness. Participate on Discord. Lets GROW TOGETHER!
Up-vote this comment to grow my power and help Open Source contributions like this one. Want to chat? Join me on Discord https://discord.gg/Pc8HG9x