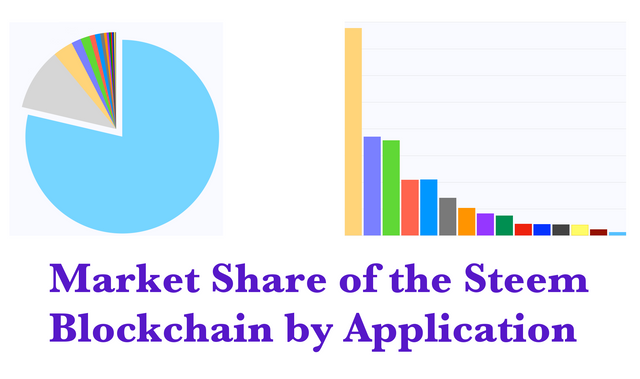
Market Share of the Steem Blockchain by Application: February 2018 Analysis
There are now many different applications and platforms that can be used to post on the Steem blockchain. These platforms are a key part of the value proposition of the blockchain and of the underlying Steem currency. The aim of this analysis is to provide an understanding of the growth and market share of these platforms, giving users some easily digestible figures to assess their continuing development.
This analysis covers:
- Background: An overall view of the Steem blockchain user metrics for February 2018 to provide a backdrop for the analyses that follow.
- Breakdown by Market Share: The breakdown and ranking of the key Steem blockchain user metrics by platform for the month of February 2018. Analyses are made for: Regular Posters, Post Numbers and Post Payouts. Comparisons are made to January 2018 showing the changes in ranking and the growth from January to February.
- Conclusions and Trends: A brief consideration of trends and drivers for the next few months.
0 Summary of Findings and Conclusions
I start by presenting the summary of findings for readers who have limited available time. The full details of the analysis are included in the later sections of this article.
Please note that throughout this analysis:
- The figures include only main posts; they do not include comments.
- All payouts considered throughout this article are expressed in the currency as seen on the Steemit interface, i.e. SBD treated as $1.
0.1 Background: An overall view of the Steem blockchain user metrics for February 2018
This first analysis provides an overview of the Steem blockchain user metrics for February 2018 to provide a backdrop for the analyses that follow.
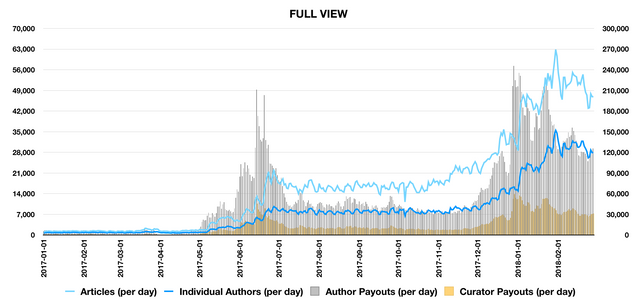
In the graphs below:
- The light blue line is the number of articles per day and the dark blue line is number of distinct authors. These are plotted against the left hand axis.
- The silver columns are author rewards and the gold columns are curator rewards. These are plotted against the right hand axis.
Full View across 2017 and 2018:
Focus on last three months:
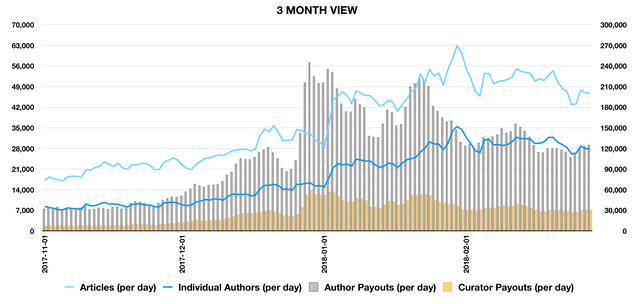
The three month period from November 2017 to the end of January 2018 was one of very strong, almost exponential growth for the overall Steem blockchain. By contrast February represented a period of consolidation with metrics slipping back from their January highs but remaining well above 2017 values.
- Overall author numbers per day at the end of February were around 10% lower than at the end of January (both sets of figures based on averages over the last week of the month) - a reduction from around the 31,000 level to the 28,000 level.
- Post numbers also decreased over the same period - approximately a 20% reduction from the 56,000 level to around 46,000.
- Post payouts per day were around 25% lower over the same period. This reduction was driven by the fall in the underlying Steem price (a fall which mirrors the general contraction of the crypto market as a whole).
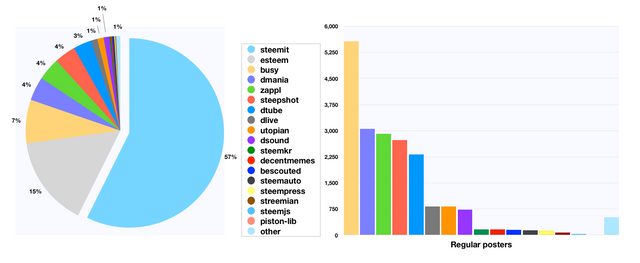
0.2 Breakdown by Market Share: Regular Posters
For the breakdown by market share I start by looking at regular poster numbers. I have defined regular posters as users that have posted four or more articles over the month.
The following table shows the number of regular posters for each application over February. The "Change" column is a comparison to the month of January. The rankings are shown for February, with the January ranking in parentheses.
| Application | Regular posters | Change | Ranking |
|---|---|---|---|
| steemit | 43,068 | -11% | 1 (1) |
| esteem | 11,635 | +32% | 2 (2) |
| busy | 5,572 | +41% | 3 (3) |
| dmania | 3,057 | +45% | 4 (6) |
| zappl | 2,916 | +2,600% | 5 (13) |
| steepshot | 2,736 | +11% | 6 (5) |
| dtube | 2,322 | -19% | 7 (4) |
| dlive | 825 | +60% | 8 (8) |
| utopian | 820 | -32% | 9 (7) |
| dsound | 737 | +70% | 10 (10) |
| steemkr | 168 | +4% | 12 (11) |
| decentmemes | 164 | +152% | 13 (16) |
| bescouted | 152 | 0% | 14 (12) |
| steemauto | 140 | +92% | 15 (15) |
| steempress | 126 | 0% | 16 (0) |
| streemian | 78 | -24% | 17 (14) |
| steemjs | 33 | -8% | 18 (17) |
| piston-lib | 17 | -23% | 19 (19) |
| other | 518 | +4% | 11 (9) |
| Total Result | 75,084 | +4% |
Overall regular user numbers were almost flat when comparing the two months in full, with just a 4% increase month on month (note that this comparison is over the whole month rather than the last week of each month as was applied for the background section above).
This overall comparison hides some interesting detail for the relative performance of each platform:
- There was no change in the top three positions, but eSteem and busy both posted strong user growth and closed the gap on Steemit slightly.
- There was huge growth for Zappl which jumped up from 13th position to 5th position overall, attracting almost three thousand regular users. Zappl received a significant boost in the first week of February with delegation of 500k Steem Power from the steemit central team through @misterdelegation. It looks like this is being put to good use!
- dMania jumped up into the top five applications, climbing two places from 6th to 4th, with 45% growth in regular users month on month. Note that this 4th position is dependent on the definition of users - if all posters (rather than regular posters) are considered then dTube holds the 4th position.
- The list of applications is growing! Decentmemes launched in the last week of January and Steempress kicked off in the middle of February. Both have reached sufficient volumes for inclusion in the rankings.
In terms of market share, Steemit now contributes 57% of regular user numbers whilst all other applications combined have now risen to 43% - a significant increase from 33% in January and 25% in December. Will we see a 50-50 split in March?
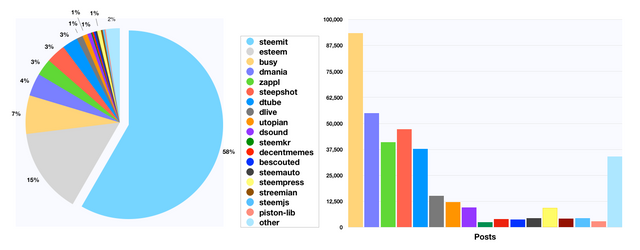
0.3 Breakdown by Market Share: Post Numbers:
The next analysis looks at post numbers (it should be noted that the number of posts does not include comments).
The following table shows the number of posts for each application over February. Again, the "Change" column is a comparison to the month of January.
The order in the table has been maintained from the "Regular Users" table to illustrate how different applications may have different market share rankings depending on which metric is applied (and it should also be noted that the usefulness of the various metrics differs between one application and another).
| Application | Posts | Change | Ranking |
|---|---|---|---|
| steemit | 824,893 | -17% | 1 (1) |
| esteem | 208,104 | +18% | 2 (2) |
| busy | 93,451 | +34% | 3 (3) |
| dmania | 54,907 | +39% | 4 (6) |
| zappl | 41,013 | +1,674% | 6 (17) |
| steepshot | 47,241 | +9% | 5 (5) |
| dtube | 37,737 | -14% | 7 (4) |
| dlive | 15,245 | +87% | 9 (10) |
| utopian | 12,113 | -35% | 10 (8) |
| dsound | 9,585 | +87% | 11 (11) |
| steemkr | 2,538 | -14% | 19 (15) |
| decentmemes | 4,025 | +332% | 16 (19) |
| bescouted | 3,798 | +25% | 17 (14) |
| steemauto | 4,453 | +193% | 14 (18) |
| steempress | 9,332 | 0% | 12 (0) |
| streemian | 4,226 | -13% | 15 (12) |
| steemjs | 4,550 | -75% | 13 (9) |
| piston-lib | 2,885 | -40% | 18 (13) |
| other | 34,092 | +34% | 8 (7) |
| Total Result | 1,414,188 | -4% |
The picture for post numbers is similar to that seen for regular user numbers.
- The top three are unchanged: Steemit retained the top spot but slipped slightly while both eSteem and Busy posted growth.
- Growth was huge for Zappl, with 41k Zaps, up from 2k in January.
- dMania jumped up into the top 5 under this metric as it did for regular users.
- steemjs showed a 75% reduction in post numbers, down to 4k from 18k in January and 35k in December. From my experience this points to more good work being done to control the level of spam posts on the Steem blockchain.
The market share figure for Steemit is similar to that derived by regular posters at 58%.
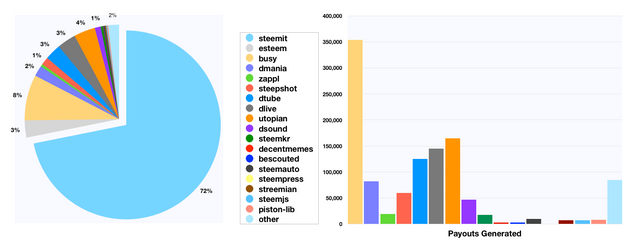
0.4 Breakdown by Market Share: Post Payouts:
Finally, a consideration of post payout numbers.
The following table shows the amount of post payout for each application over February. Again, the "Change" column is a comparison to the month of January.
(Figures have been extracted at 8 March so all post payouts should be final).
| Application | Payouts Generated | Change | Ranking |
|---|---|---|---|
| steemit | 3,245,635 | -39% | 1 (1) |
| esteem | 132,610 | -32% | 5 (4) |
| busy | 353,620 | -27% | 2 (2) |
| dmania | 82,457 | +22% | 8 (8) |
| zappl | 19,836 | +560% | 11 (18) |
| steepshot | 60,161 | -28% | 9 (7) |
| dtube | 125,137 | -32% | 6 (5) |
| dlive | 145,090 | +123% | 4 (9) |
| utopian | 164,637 | -46% | 3 (3) |
| dsound | 46,644 | +17% | 10 (11) |
| steemkr | 17,488 | -62% | 12 (10) |
| decentmemes | 3,047 | +88% | 17 (19) |
| bescouted | 2,801 | -50% | 18 (15) |
| steemauto | 10,234 | +168% | 13 (17) |
| steempress | 827 | 0% | 19 (0) |
| streemian | 7,216 | -72% | 15 (12) |
| steemjs | 7,092 | +61% | 16 (16) |
| piston-lib | 8,289 | -63% | 14 (13) |
| other | 84,571 | -20% | 7 (6) |
| Total Result | 4,517,393 | -35% |
Overall post payouts decreased by 35% from January to February, largely driven by the fall in the Steem price (which mirrored the contraction in the crypto market as a whole).
- Steemit, busy and utopian retained their positions as the top three rankings.
- DLive posted over 100% growth in payouts and jumped up into the top five rankings.
- Zappl, dMania and DSound also posted positive figures despite the overall fall in available rewards.
The market share figure for steemit.com is much higher on a post payout basis than for the other metrics.
0.5 Conclusions and Trends:
The overall picture for the blockchain remains healthy. A period of consolidation is to be expected following the exceptionally strong growth in the prior three months. Whilst all metrics are down from their highs it is encouraging to see that stabilisation seems to be occurring at levels well in excess of those seen in the latter half of 2017.
The strongest growth and largest climbs in rankings came from Zappl and dMania. As in January when dTube, DLive and DSound grew strongly the growth of these platforms has been aided by significant delegation from the Steemit central team. The use of this Steem Power to help grow platforms, attract users, and promote entrepreneurship on the Steem blockchain seems a worthwhile use of capital that was previously tied up in the @steemit account.
Looking forward, resolve is likely to be further tested across March as the Steem price currently stands around 20% lower than its value at the end of February. It is a testing time for crypto projects as a whole but the solidification of a larger user base sets the Steem project up well for a new period of growth if markets turn back to green.
Outline
- 0 Summary of Findings and Conclusions (see above)
- 0.1 Background: An overall view of the Steem blockchain user metrics for February 2018
- 0.2 Breakdown by Market Share: Regular Posters
- 0.3 Breakdown by Market Share: Post Numbers
- 0.4 Breakdown by Market Share: Post Payouts
- 0.5 Conclusions and Trends
- 1 Scope of Analysis
- 2 Tools Used
- 3 Scripts
1 Scope of Analysis
The analysis is based on the data for all user accounts over January and February 2018.
The data has been obtained through SQL queries of SteemSQL, a publicly available Microsoft SQL database built and maintained by @arcange and containing all the Steem blockchain data.
The data has been separated by application by use of the app label information in the json_metadata column of the Comments table. One limitation of this approach is that modifying an article in another application causes the app label information in the json_metadata column to change to that of the modifying platform. However it is expected that this limitation has minimal effect.
The data has been filtered by date using the .created timestamps in the comments table
2 Tools Used
Valentina Studio, a free data management tool, was used to run the SQL queries. The raw data was then verified and analysed and the graphs and charts were produced using Numbers, the Mac spreadsheet tool.
SQL scripts are included at the end of this analysis.
Summary of Findings
Analysis findings have been included in the Summary of Findings at the start of the report.
3 Scripts
I used the following script to obtain the data:
SELECT
    Comments.author AS [Author],
     IIF(isjson(json_metadata) = 1, IIF(CHARINDEX('/', json_value(json_metadata, '$.app')) > 0, SUBSTRING(json_value(json_metadata, '$.app'), 1, CHARINDEX('/', json_value(json_metadata, '$.app'))-1),json_value(json_metadata, '$.app')), null) as [SummarisedApp],
    Count(Comments.author) AS [Posts],
    Count(distinct Comments.author) AS [DistinctCommentAuthor],
    count(Comments.parent_author) AS [ParentAuthor],
    count(distinct Comments.parent_author) AS [DistinctParentAuthor],
    sum(CONVERT(REAL,Comments.pending_payout_value)) AS [PendingPayoutValue],
    sum(CONVERT(REAL,Comments.curator_payout_value)) AS [CuratorPayoutValue],
    sum(CONVERT(REAL,Comments.total_payout_value)) AS [TotalPayoutValue]

FROM
    Comments (NOLOCK)

WHERE
    YEAR(Comments.created) = 2018 AND
    MONTH(Comments.created) = 2 and
    depth = 0

GROUP BY
    Comments.author,
    IIF(isjson(json_metadata) = 1, IIF(CHARINDEX('/', json_value(json_metadata, '$.app')) > 0, SUBSTRING(json_value(json_metadata, '$.app'), 1, CHARINDEX('/', json_value(json_metadata, '$.app'))-1),json_value(json_metadata, '$.app')), null)
A very similar script was used for the extraction of data by day. Briefly the small differences were:
- Replacement of author by comment creation date in both SELECT and GROUP BY clauses.
- Change of dates in WHERE clause to allow full calendar of data to be obtained
That's all for today. Thanks for reading!
Posted on Utopian.io - Rewarding Open Source Contributors
Thank you for the contribution. It has been approved.
Hey @miniature-tiger, haven't seen you posting for a while, glad you're back :) Great work!
You can contact us on Discord.
[utopian-moderator]
Thanks @crokkon!
Yes, I had a few things to sort out and then afterwards I decided to take a break from steemit for a couple of weeks.
I should have some more analyses this week for you to moderate.
This is pretty awesome. I always like looking at data like this. This goes to show how robust the steem blockchain is becoming due to the fact that so many widely used applications are running on it. Even if Steemit itself were to collapse, steem would still be worth something. I remember people talking about this back when beta first launched. Now it's become real. Very cool.
Thanks @randr10.
I really think that this is where the value lies for the Steem blockchain. There's potential to capture some of the market for other blockchain projects (such as LBRY) and to become the go-to blockchain for content creation. Combining this with SMTs could then be a very powerful tool.
Checked your blog. Excellent insights. Following for more. I just hope you'd post more often. Good Luck!
Thanks! Yes, I'll hopefully put a few more analyses up this week.
Great to know. Looking forward to it.
this really is superb,, thanks for the analysis mate
No problem!
You’re back! You have been missed!
Thanks @jayna, very sweet of you to say so! And thanks also for picking up the fiftywords baton. Great job on that.
It has been fun! I need to pick a winner. Are you ready to start it up again? 😊
Actually I don't know some of them thank you @miniature-tiger
Congratulations! Your post has been selected as a daily Steemit truffle! It is listed on rank 2 of all contributions awarded today. You can find the TOP DAILY TRUFFLE PICKS HERE.
I upvoted your contribution because to my mind your post is at least 108 SBD worth and should receive 291 votes. It's now up to the lovely Steemit community to make this come true.
I am
TrufflePig, an Artificial Intelligence Bot that helps minnows and content curators using Machine Learning. If you are curious how I select content, you can find an explanation here!Have a nice day and sincerely yours,

TrufflePigThanks @miniature-tiger for the careful analysis and data breakdown. Just wanted to help tighten up a few things to make this an even more factually-correct piece 😊
Your article says that the 3-month period between November 1, 2017 and February 1, 2018 was a period of almost exponential growth for the overall steam blockchain. Technically this wasn't exponential growth - - it was linear growth. 🤓 Not trying to be a downer, just trying to avoid hype in statistics
Number of articles per day did increase by over 3 times (reaching a maximum of almost 4 times during its peak), and the number of individual authors per day increased over 4 times (with the maximum being five times during its peak), and the author payouts her day did hit a 4x increase by the end of that period, but all of these are linear, not exponential. Although we would certainly love to see exponential growth on the steem blockchain.
Would be great to see your qualitative take (not just pure quantitative) of your findings also! Maybe I will try to interpret your data qualitatively if I find time!
Hey @miniature-tiger I am @utopian-io. I have just upvoted you!
Achievements
Community-Driven Witness!
I am the first and only Steem Community-Driven Witness. Participate on Discord. Lets GROW TOGETHER!
Up-vote this comment to grow my power and help Open Source contributions like this one. Want to chat? Join me on Discord https://discord.gg/Pc8HG9x