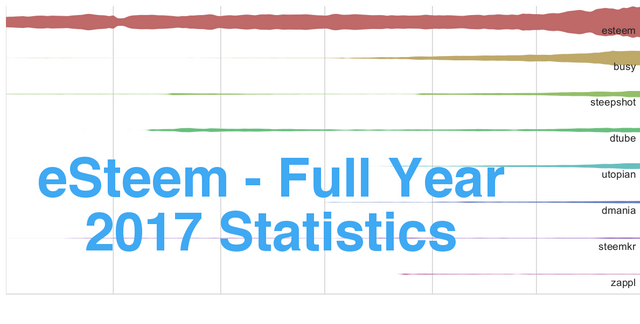
eSteem - Full Year 2017 Statistics
In this second study of the 2017 full year statistics for the steem blockchain platforms I will look at the figures for eSteem.
eSteem is an open source blogging application built on top of the steem blockchain. It is a mobile based application, allowing users to access the blockchain whilst on the move. It is available to all steem accounts but in particular provides accessibility to users whose only method to connect to the internet is through their mobile device.
There are three parts to the analysis:
Overview of 2017: An overview of the figures for the full year 2017 (daily individual author numbers, post numbers and reward payouts) illustrating the growth in the platform over the second half of the year;
Location analysis: A breakdown of the 2017 users by location to understand the main locations for the user base; and
Top 50 users: A summary of the payouts for the 50 users over 2017 showing those users that have had most financial success over 2017 through the platform.
Outline
- Scope of Analysis
- Tools Used
- Overview of 2017
- Location Analysis
- Top 50 users
- Scripts
1 Scope of Analysis
The analysis is based on the data for the eSteem application obtained through SQL queries of SteemSQL, a publicly available Microsoft SQL database containing all the Steem blockchain data.
The eSteem data has been filtered from the overall steem blockchain data by filtering on the app label information in the json_metadata column of the Comments table. One limitation of this approach is that modifying an article in another application causes the app label information in the json_metadata column to change to that of the modifying platform. However it is expected that this limitation has minimal effect.
The analysis focuses on articles posted in 2017. The data has been filtered by date using the timestamps in the created column of the Comments table.
Location information has been obtained from the location label information in the json_metadata column of the Accounts table.
2 Tools Used
Valentina Studio, a free data management tool, was used to run the SQL queries. The raw data was then verified and analysed in the spreadsheet application of the LibreOffice office suite.
Graphs and charts were produced using Numbers, the Mac spreadsheet tool, or using RAWGraphs, an open source data visualisation framework.
SQL scripts are included at the end of this analysis.
3 Overview of 2017
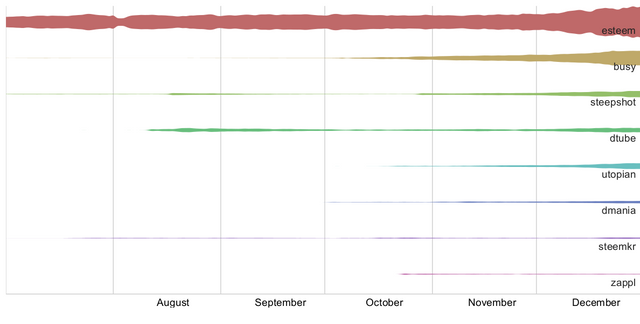
eSteem has consistently been the second largest of the steem blockchain applications when measured by numbers of posters and number of posts. This chart illustrates the relative size of the “alternative” steem apps (i.e. excluding steemit.com) measured by the number of individual authors per day. The time period is the second half of 2017.
eSteem also managed to grow substantially throughout 2017 under all three metrics: articles, authors, and payouts. The chart below covers the full year 2017 for the eSteem application:
- The light blue line is the number of articles per day and the dark blue line is number of distinct authors. These are plotted against the left hand axis.
- The silver columns are author rewards and the gold columns are curator rewards. These are plotted against the right hand axis.
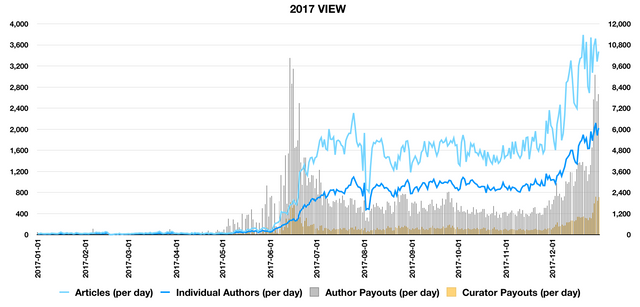
Key growth spurts can be seen in June and December 2017, both periods when the price of the underlying steem currency was increasing significantly. It will be interesting to see how the statistics react over January given the rapid rise and fall in the steem price that has already occurred in the month.
Finally the table of monthly figures for eSteem shows continual growth in article numbers and poster numbers over 2017.
| Month | All Posters | Regular Posters | All Posts | Total Payouts |
|---|---|---|---|---|
| Jan | 154 | 48 | 809 | 2,095 |
| Feb | 122 | 51 | 712 | 1,928 |
| Mar | 156 | 66 | 1,070 | 1,797 |
| Apr | 137 | 58 | 801 | 2,364 |
| May | 401 | 155 | 2,434 | 24,872 |
| Jun | 2,205 | 1,093 | 21,939 | 132,169 |
| Jul | 4,259 | 2,339 | 54,723 | 71,428 |
| Aug | 4,056 | 2,222 | 46,211 | 61,099 |
| Sep | 4,206 | 2,393 | 49,038 | 63,413 |
| Oct | 4,366 | 2,378 | 47,203 | 49,543 |
| Nov | 3,932 | 2,232 | 51,260 | 47,889 |
| Dec | 6,964 | 3,995 | 87,538 | 145,961 |
| Total | 363,738 | 604,558 |
The December figures showed a 200% increase in total payouts generated and over 70% increases in poster numbers and post numbers.
User retention was also strong over December, with 70% of November posters also posting in December (this only considers posts, not comments). New users of the platform in December were roughly equally split between new December steem blockchain accounts and existing accounts diversifying into eSteem.
4 Location Analysis
The aim of this second part of the analysis is to understand the main locations for the eSteem user base over 2017. It is one of the aims of eSteem to reach users whose only method to connect to the internet is through their mobile device.
The location analysis relies on steem users filling in the location information in their profile. Unfortunately a majority of users do not complete this information. Of the 15,465 users who posted (not including comments) over 2017 I was only able to analyse 36%. As such the results of the analysis can only be considered indicative.
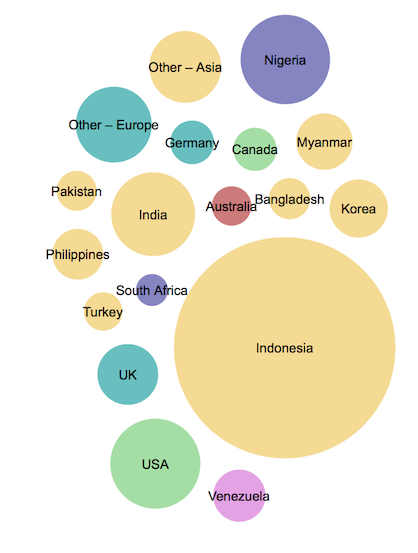
The largest number of posters over 2017 (of those analysed) were located in Indonesia, the USA, Nigeria, and India.
5 Top 50 Users
Finally, a sunburst chart of the top 50 users by author payout for the eSteem platform over 2017 (excluding @good-karma the developer of eSteem who would otherwise be the number 1 rated user).
A further layer of breakdown - the main tags under which they post - has also been added (“other” is typically seen where posters use a wide variety of main tags).
It is worth noting that there are a couple of limitations to this analysis:
- Some author payouts will have been augmented by votes from upvote bots. As such the net earnings will be lower than those seen here.
- The amounts are expressed as per the payout values shown on steem platform sites - no conversion has been made to US$ or to Steem. The value of payouts can actually differ quite substantially from one month to the next, depending on the value of the underlying currencies.
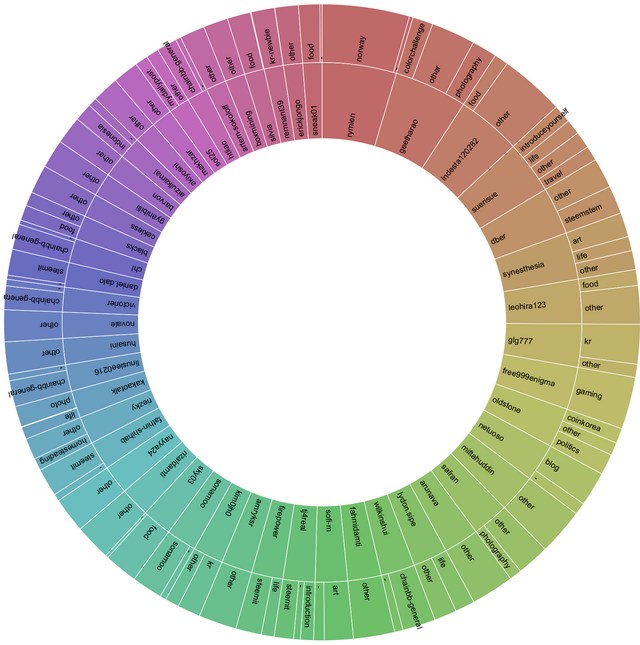
It is interesting that the author payout rewards are really quite evenly split over the top 50 users. This may be a function of the way the application is used - perhaps a mobile app is used for more frequent and shorter posts with less differentiation in the rewards obtained.
6 Scripts
This was the main script used for the analysis.
/* SINGLE APP ANALYSIS by AUTHOR and MONTH - 2017 Full year */
SELECT
    Comments.author,
    Month(Comments.created) as [CommentMonth],
    IIF(isjson(comments.json_metadata) = 1, IIF(CHARINDEX('/', json_value(comments.json_metadata, '$.app')) > 0, SUBSTRING(json_value(comments.json_metadata, '$.app'), 1, CHARINDEX('/', json_value(comments.json_metadata, '$.app'))-1),json_value(comments.json_metadata, '$.app')), null) as [Application],
    Count(Comments.author) AS [Posts],
    Count(distinct Comments.author) AS [DistinctCommentAuthor],
    count(Comments.parent_author) AS [ParentAuthor],
    count(distinct Comments.parent_author) AS [DistinctParentAuthor],
    sum(CONVERT(REAL,Comments.pending_payout_value)) AS [PendingPayoutValue],
    sum(CONVERT(REAL,Comments.curator_payout_value)) AS [CuratorPayoutValue],
    sum(CONVERT(REAL,Comments.total_payout_value)) AS [TotalPayoutValue]
FROM
    Comments (NOLOCK)
WHERE
    YEAR(Comments.created) = 2017 AND
    depth = 0 AND
    IIF(isjson(comments.json_metadata) = 1, IIF(CHARINDEX('/', json_value(comments.json_metadata, '$.app')) > 0, SUBSTRING(json_value(comments.json_metadata, '$.app'), 1, CHARINDEX('/', json_value(comments.json_metadata, '$.app'))-1),json_value(comments.json_metadata, '$.app')), null) = 'busy'
GROUP BY
    Comments.author,
Month(Comments.created) as [CommentMonth]
    IIF(isjson(comments.json_metadata) = 1, IIF(CHARINDEX('/', json_value(comments.json_metadata, '$.app')) > 0, SUBSTRING(json_value(comments.json_metadata, '$.app'), 1, CHARINDEX('/', json_value(comments.json_metadata, '$.app'))-1),json_value(comments.json_metadata, '$.app')), null)
Very similar scripts were used for the location analysis and the extraction of data by day. Briefly the small differences are:
- Changing from grouping by the month of the comment creation date to the exact date of comment creation allows the extraction by individual date. The author information is not required for this run (and the results would be very large by author and date)
- An inner join to the Accounts table allowed the additional location data to be extracted.
That's all for today. Thanks for reading!
Posted on Utopian.io - Rewarding Open Source Contributors
Great Data!
Seriously. How does one have a 78 dollar post go to 70 when the price of both the steem dollar and coin have stay virtually the same??!! @ned ? @jerrybanfeild?
Can someone please explain to me why it is I'm losing drastic value my steam back dollar post amounts even a steam back dollar has stayed the same price or fluctuated by only $0.30. On a $78 post yesterday is now under $75? My whole account lost over 20 SBD for what seems like no reason as the coin and dollar price is virtually the same as yesterday. This is extremly fustrating to watch and discouraging. @ned
Your analysis has really made me easy with esteem and to be honest, before this I never used esteem, but after reading your article only, I am getting used to.
Thank you for such a detailed analysis.
Have a great day.
No problem. Thanks for stopping by!
Just a comment to note that this post is past its seven day payout period so no longer accepts upvotes.
You can check out my latest posts here if your votes are burning a hole in your pocket: @miniature-tiger !!!
Good and nice information many thanks.
By the way here we exist one or two person in El Salvador centralamerica for your considerations.
Thank you so much.
No problem. And yes, a few eSteem users in El Salvador, but many more in Venezuela, as far as I can tell from the data.
Amazing how i could identify salvadoream user???? I feel i am alone no more than 2 me and others could you help me to identify them. ?????
From a quick look at the accounts data I have:
xak, balbuceando, jorgem2, sibelius6809, galberto, sucot2004, arqheos
who have all made a comment or post since 1 December 2017 and who list El Salvador as their location. But you are by far the largest SP holder. You're going to have to spread the word a little!
Many thanks i review this user for identify and visit them, i invited every of my friend but they do not believe, me i will continued work hard thank for help me i apreciate it
Best regard @galberto
Thank you for the contribution. It has been approved.
Hi @minitature-tiger, great work again!
Just out of curiosity: How did you filter the locations? Is it just a check if the exact string is in a dictionary of known countries, or did you go deeper like substring parsing, or detecting region names within a country etc?
You can contact us on Discord.
[utopian-moderator]
Thanks @crokkon!
It was very manual
(deep shame).I put all the locations into a pivot table, sorted by count, and then went through the list from the top. I think the first one was Indonesia, so I searched all the other strings for Indonesia, and summed the count if there was a hit (so Berlin, Germany would be a hit for Germany for example).
And then I went down the list, making sure not to double count, and grouping cities into the right country etc (i.e. Berlin by itself in with Germany). Very manual!
I'm not a big fan of the location analyses, just because they rely on user input, and not enough people enter the details for it to be scientific. So I didn't want to spend too long developing something more complex. But for eSteem it's one of their aims to reach developing countries so I thought it was important to see whether that was the case. There's enough data for it to be interesting and indicative but not enough to prove any firm conclusions.
I'd be interested if @good-karma and the team have better data themselves, from it being a mobile app, and whether that correlates to the data above or if it's wide of the mark.
No, not "deep shame", rather the opposite. Kudos for digging through the data by hand! :)
Free text fields are hard to analyze because users can put anything there and I guess your approach still provides the most reliable results.
Adding a GPS location to the the
json_metadatacould actually make a nice (OPTIONAL) feature for reliable location reporting...WOW @miniature-tiger, as a newbie, I was curious to see Indonesia (Where I live), rate so high on the list and well above everyone else! At first I thought it was targeting posts to my location, a bit like the other (unnamed) social portals do with their ads, but it appears there a lot of Indonesian folk out there with time on their hands to contribute.
Nice analysis as always, and perty graphics too, although TBH my main question is WTF is esteem? Something else to explore for tomo, as you say, that's all for today.
Timed that right for a nice little curation reward, I think. Something I'll be analyzing at some point.
Night!
So many apps now it's hard to keep track! But eSteem was one of the earliest ones I believe.
I think you're right on the curation too. @crokkon's analysis, a few days back, was really interesting on curation timing. I tend to run late, which does not surprise me!
Great. I will take my time to check this deeper. Seeing that Western occidental world is not leading is good path toward more worldwidee balance redistribution. thank you for this study
Yes, I believe that part of the aim was to try and bring steem to users in developing countries and superficially it looks like that could be succeeding.
But I couldn't really talk more about it in the analysis because there's really little information about the type of users in those countries who use the app. So they could all be very rich. But it's an interesting chart for debate so I decided to include it even though the numbers are a little thin.
This is honestly the first time ive heard of esteem, I will be looking into this. Is this going to be the official mobile app for @steemit ? I heard they are working on one also. Thank for the data!
I didn't realise there would be a steemit mobile app also. I think the team has a lot on their plate already!
Great infographics, I like your analysis!
Thank you!
Hi @miniature-tiger... I have been using this esteem application, since last 7 months after my son @firepower got me this phone.. In last few months, I have written about so many things on this beautiful platform. Thank you so much for sharing a good post with all these statistics. After reading your post, I came to know that I am one among the top users.
And I am extremely grateful to @good-karma for developing and working hard behind the success of this app. As I am still not familiar with laptop, I am using only esteem app for all my work!!.
Thank you once again @miniature-tiger..
Reblogged this post....
Congratulations! Yes, you are right up near the top.
I think that's part of the idea with eSteem, to bring the steem blockchain to people who just use phones, not laptops. I'm glad to hear that it's hitting the mark.
And thanks for the resteem. Much appreciated!