使用hcharts创建漏斗图/How to use hcharts to make a funnel chart
Summary:
Javascript has a lot of open source chart Libraries,Hcharts.js is one of them,today i will show you how to create a funnel chart by Hcharts.
Javascript 有很多开源图表库,Hcharts.js就是其中之一,今天教程将教大家如何使用Hcharts.js去绘制一张漏斗图。
- 兼容浏览器:IE, Chrome,Firefox等等
您能从本教程学到什么?
- 代码整体结构
- 怎么调用hcharts.js
- 怎么设置图表画布大小以及图表chart配置
- 怎么设置图表主副标题
- 怎么设置通用配置
- 怎么设置图例
- 怎么设置数据列
需要的准备条件
- 你需要一个代码编辑器,比如atom,EmEditor等等,当然因为是文本编辑,可以直接通过浏览器打开,typora这类文本编辑器也可以进行代码编辑。
- 你需要下载hcharts.js(如果不下载到本地,也可以在线调用,参考要点2.)
本教程难度
相对来说比较简单,只需要对固定代码格式有些简单了解,就可以绘制漏斗图。
- 认识简单代码
- 认识简单英文
教程内容
下面请先看一个简单例子:
要点1:代码整体结构
<html>
<head>
<meta charset="utf-8">
<title>title</title>
<script src="https://img.hcharts.cn/jquery/jquery-1.8.3.min.js"></script>
<script src="https://img.hcharts.cn/highcharts/highcharts.js"></script>
<script src="https://img.hcharts.cn/highcharts/highcharts-more.js"></script>
<script src="https://img.hcharts.cn/highcharts/modules/exporting.js"></script>
<script src="https://img.hcharts.cn/highcharts-plugins/highcharts-zh_CN.js"></script>
</head>
<body>
<div id="container" style="height: 400px"></div>
<script>
    $(function () {
        $('#container').highcharts({
       //key code
        })
//hcharts.js  code area!
</script>
</body>
</html>
html结构,我们创建图表的代码是js语句,所以关键代码是放在< script>里面。下面将详细讲解关键代码。
要点2:怎么调用hcharts.js
<script src="https://img.hcharts.cn/jquery/jquery-1.8.3.min.js"></script>
<script src="https://img.hcharts.cn/highcharts/highcharts.js"></script>
<script src="https://img.hcharts.cn/highcharts/highcharts-more.js"></script>
<script src="https://img.hcharts.cn/highcharts/modules/exporting.js"></script>
<script src="https://img.hcharts.cn/highcharts-plugins/highcharts-zh_CN.js"></script>
如果本地没有hcharts.js库,可以使用其在线js资源,同时需要加载jquery.min.js。直接在head区域引用就可以了。
要点3:怎么设置图表画布大小
<div id="container" style="min-width: 410px; max-width: 600px; height: 400px; margin: 0 auto"></div>
在body区域,编辑chartjs代码之前,需要先定义下图表的大小。上面代码定义,最小宽度410px,最大宽度600px,高为400px。
 chart: {
            type: 'funnel',
            marginRight: 100
        },
type:图表 类型,默认是line,这里是漏斗图,所以设置为funnel。
marginRight:右外边距
要点4:怎么设置图表主副标题
  title: {
            text: 'funnel chart',
            x: -50
        },
subtitle: {
            text: 'This is a demo <br/>@jubi',
            x: -50
        },
titel:标题,text后输入标题文本,支持html标签。
subtitle:副标题,text后输入标题文本,支持html标签。实例如下:
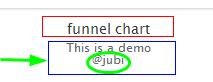
x为,标题水平方向的偏移量,可通过更改数值来改变水平方向上标题的位置。
要点5:怎么设置通用配置
 plotOptions: {
            series: {
                dataLabels: {
                    enabled: true,
                    crop : false,
                    overflow: 'justify',
                    format: '<b>{point.name}</b> ({point.y:,.0f})',
                    color: (Highcharts.theme && Highcharts.theme.contrastTextColor) || 'black',
                    softConnector: true
                },
                neckWidth: '30%',
                neckHeight: '25%'
            }
        },
enabled: 标签是否显示,设置为true 显示标签,false则不显示。
- enabled:true 实例如下:
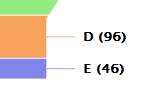
- enabled:false实例如下:

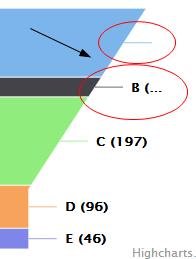
crop:标签是否裁剪。设置为true, 则超出范围的标签不显示或者显示不全,false则不裁剪。
- crop : false 实例如下:
- crop : true实例如下:
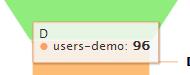
format 数据点显示样式,实例如下:
color 颜色设置
neckWidth/neckHeight 设置漏斗图宽和高
要点6:怎么设置图例
 legend: {
            enabled: false
        },
漏斗图本身就不需要图例,所以此处参数设置为false,当然这段代码也可以直接不写。
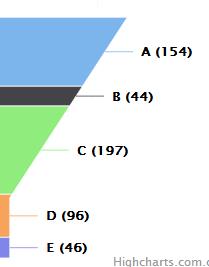
要点7:怎么设置数据列
series: [{
            name: 'users-demo',
            data: [
                ['A',154],
                ['B',44],
                ['C',197],
                ['D',96],
                ['E',46]
            ]
        }]
name 数据名称
data 具体数据 格式为:data:[['name1',data1],['name2',data2]……]
完整实例如下:
完整代码如下:
<html>
<head>
<meta charset="utf-8">
<title>title</title>
<script src="https://img.hcharts.cn/jquery/jquery-1.8.3.min.js"></script>
<script src="https://img.hcharts.cn/highcharts/highcharts.js"></script>
<script src="https://img.hcharts.cn/highcharts/highcharts-more.js"></script>
<script src="https://img.hcharts.cn/highcharts/modules/exporting.js"></script>
<script src="https://img.hcharts.cn/highcharts-plugins/highcharts-zh_CN.js"></script>
</head>
<body>
<div id="container" style="height: 400px"></div>
<script>
$(function () {
    $('#container').highcharts({
        chart: {
            type: 'funnel',
            marginRight: 100
        },
        title: {
            text: 'funnel chart',
            x: -50
        },
        subtitle: {
            text: 'This is a demo <br/>@jubi',
            x: -50
        },
        plotOptions: {
            series: {
                dataLabels: {
                    enabled: true,
                    crop : false,
                    overflow: 'none',
                    format: '<b>{point.name}</b> ({point.y:,.0f})',
                    color: (Highcharts.theme && Highcharts.theme.contrastTextColor) || 'gray',
                    softConnector: true
                },
                neckWidth: '30%',
                neckHeight: '25%'
                //-- Other available options
                // height: pixels or percent
                // width: pixels or percent
            }
        },
        legend: {
            enabled: false
        },
        series: [{
            name: 'users-demo',
            data: [
                ['A',   154],
                ['B',      244],
                ['C', 1197],
                ['D',    196],
                ['E',    462],
                ['F', 197],
                ['G',    916],
                ['H',    146],
                ['I', 1197],
                ['J',    196],
                ['K',    416]
            ]
        }]
    });
});
</script>
</body>
</html>
Posted on Utopian.io - Rewarding Open Source Contributors
Thank you for the contribution. It has been approved.
You can contact us on Discord.
[utopian-moderator]
Thank you very much
it looks helpfull
Hey @jubi I am @utopian-io. I have just upvoted you!
Achievements
Suggestions
Get Noticed!
Community-Driven Witness!
I am the first and only Steem Community-Driven Witness. Participate on Discord. Lets GROW TOGETHER!
Up-vote this comment to grow my power and help Open Source contributions like this one. Want to chat? Join me on Discord https://discord.gg/Pc8HG9x