使用hcharts创建面积图/How to use hcharts to make a area chart
Summary:
Javascript has a lot of open source chart Libraries,Hcharts.js is one of them,today i will show you how to create a area chart by Hcharts.
Javascript 有很多开源图表库,Hcharts.js就是其中之一,今天教程将教大家如何使用Hcharts.js去绘制一张面积图。
- 兼容浏览器:IE, Chrome,Firefox等等
您能从本教程学到什么?
- 代码整体结构
- 怎么调用hcharts.js
- 怎么设置图表画布大小以及图表chart配置
- 怎么设置X和Y轴
- 怎么设置提示框
- 怎么设置通用配置
- 怎么设置数据列
需要的准备条件
- 你需要一个代码编辑器,比如atom,EmEditor等等,当然因为是文本编辑,可以直接通过浏览器打开,typora这类文本编辑器也可以进行代码编辑。
- 你需要下载hcharts.js(如果不下载到本地,也可以在线调用,参考要点2.)
本教程难度
相对来说比较简单,只需要对固定代码格式有些简单了解,就可以绘制面积图。
- 认识简单代码
- 认识简单英文
教程内容
下面请先看一个简单例子:
要点1:代码整体结构
<html>
<head>
<meta charset="utf-8">
<title>title</title>
<script src="https://img.hcharts.cn/jquery/jquery-1.8.3.min.js"></script>
<script src="https://img.hcharts.cn/highcharts/highcharts.js"></script>
<script src="https://img.hcharts.cn/highcharts/highcharts-more.js"></script>
<script src="https://img.hcharts.cn/highcharts/modules/exporting.js"></script>
<script src="https://img.hcharts.cn/highcharts-plugins/highcharts-zh_CN.js"></script>
</head>
<body>
<div id="container" style="min-width:400px;height:500px"></div>
<script>
    $(function () {
        $('#container').highcharts({
       //key code
        })
//hcharts.js  code area!
</script>
</body>
</html>
html结构,我们创建图表的代码是js语句,所以关键代码是放在< script>里面。下面将详细讲解关键代码。
要点2:怎么调用hcharts.js
<script src="https://img.hcharts.cn/jquery/jquery-1.8.3.min.js"></script>
<script src="https://img.hcharts.cn/highcharts/highcharts.js"></script>
<script src="https://img.hcharts.cn/highcharts/highcharts-more.js"></script>
<script src="https://img.hcharts.cn/highcharts/modules/exporting.js"></script>
<script src="https://img.hcharts.cn/highcharts-plugins/highcharts-zh_CN.js"></script>
如果本地没有hcharts.js库,可以使用其在线js资源,同时需要加载jquery.min.js。直接在head区域引用就可以了。
要点3:怎么设置图表画布大小
<div id="container" style="min-width:400px;height:500px"></div>
在body区域,编辑chartjs代码之前,需要先定义下图表的大小。上面代码定义,最小宽度410px,高为500px。
  chart: {
            type: 'area'
        },
type:图表 类型,默认是line,这里是面积图,所以设置为area。
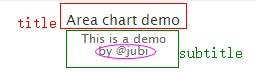
要点4:怎么设置图表主副标题
 title: {
            text: 'Area chart demo'
        },
        subtitle: {
            text: 'This is a demo<br/>by @jubi'
        },
titel:标题,text后输入标题文本,支持html标签。
subtitle:副标题,text后输入标题文本,支持html标签,比如加粗,斜体,超链接。实例如下:
要点5:怎么设置X和Y轴
 xAxis: {
            allowDecimals: false,
            labels: {
                formatter: function () {
                    return this.value;
                }
            }
        },
allowDecimals 整数设置,可社会true或者false
labels 刻度标签,这里返回的是function函数,也就是返回通用配置的参数。
 yAxis: {
            title: {
                text: 'AMOUNT'
            },
            labels: {
                formatter: function () {
                    return this.value / 1000 + 'k';
                }
            }
        },
title 标题,在text后面输入文本。显示在Y轴左侧。
labels 刻度标签,这里返回的是function函数,也就是返回通用配置的参数。
return this.value / 1000 + 'k';
显示 返回值除以1000 ,单位为k
要点6:怎么设置提示框
tooltip: {
            pointFormat: '{series.name} make <b>{point.y:,.0f}</b>$'
        },
tooltip 提示框
pointFormat 数据点显示
series.name 调用数据名称
point.y 数据y值 ,":,.0f "意思是显示整数。
要点7:怎么设置通用配置
   plotOptions: {
            area: {
                pointStart: 1952,
                marker: {
                    enabled: false,
                    symbol: 'circle',
                    radius: 2,
                    states: {
                        hover: {
                            enabled: true
                        }
                    }
                }
            }
        },
pointstart 开始刻度,x轴从1952开始。
 marker: {
                    enabled: false,
                    symbol: 'circle',
                    radius: 2,
                    states: {
                        hover: {
                            enabled: true
                        }
                    }
                }
数据点标识
enabled 是否显示数据点标识,参数为true 和false。 实例如下:
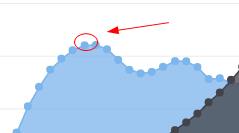
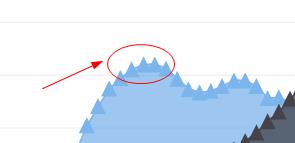
symbol 符号, circle为圆圈,也可以设置其他符号,比如三角,triangle,实例如下:
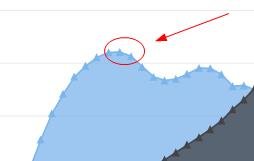
radius 数据点大小,此处设置为2,夸张一点设置为6,实例如下:
要点8:怎么设置数据列
 series: [{
            name: 'A',
            data: [null, null, null, null, null, 6.111, 11, 32, 110, 235, 369, 640,
                   1005, 1436, 2063, 3057, 4618, 6444, 9822, 15468, 20434, 24126,
                   27387, 29459, 31056, 31982, 32040, 31233, 29224, 27342, 26662,
                   26956, 27912, 28999, 28965, 27826, 25579, 25722, 24826, 24605,
                   24304, 23464, 23708, 24099, 24357, 24237, 24401, 24344, 23586,
                   22380, 21004, 17287, 14747, 13076, 12555, 12144, 11009, 10950,
                   10871, 10824, 10577, 10527, 10475, 10421, 10358, 10295, 10104]
        }, {
            name: 'B',
            data: [null, null, null, null, null, null, null, null, null, null,
                   5, 25, 50, 120, 150, 200, 426, 660, 869, 1060, 1605, 2471, 3322,
                   4238, 5221, 6129, 7089, 8339, 9399, 10538, 11643, 13092, 14478,
                   15915, 17385, 19055, 21205, 23044, 25393, 27935, 30062, 32049,
                   33952, 35804, 37431, 39197, 45000, 43000, 41000, 39000, 37000,
                   35000, 33000, 31000, 29000, 27000, 25000, 24000, 23000, 22000,
                   21000, 20000, 19000, 18000, 18000, 17000, 16000]
        }]
name 数据名称
data 数据 ,格式 data:[data1,data2,data3,data4……] 也可以设置nulll,代表数据为空。
完整实例如下:
完整代码如下:
<html>
<head>
<meta charset="utf-8">
<title>title</title>
<script src="https://img.hcharts.cn/jquery/jquery-1.8.3.min.js"></script>
<script src="https://img.hcharts.cn/highcharts/highcharts.js"></script>
<script src="https://img.hcharts.cn/highcharts/highcharts-more.js"></script>
<script src="https://img.hcharts.cn/highcharts/modules/exporting.js"></script>
<script src="https://img.hcharts.cn/highcharts-plugins/highcharts-zh_CN.js"></script>
</head>
<body>
<div id="container" style="height: 400px"></div>
<script>
$(function () {
    $('#container').highcharts({
        chart: {
            type: 'area'
        },
        title: {
            text: 'Area chart demo'
        },
        subtitle: {
            text: 'This is a demo<br/>by @jubi'
        },
        xAxis: {
            allowDecimals: false,
            labels: {
                formatter: function () {
                    return this.value; // clean, unformatted number for year
                }
            }
        },
        yAxis: {
            title: {
                text: 'AMOUNT'
            },
            labels: {
                formatter: function () {
                    return this.value / 1000 + 'k';
                }
            }
        },
        tooltip: {
            pointFormat: '{series.name} make <b>{point.y:,.0f}</b>$'
        },
        plotOptions: {
            area: {
                pointStart: 1952,
                marker: {
                    enabled: true,
                    symbol: 'cicrle',
                    radius: 4,
                    states: {
                        hover: {
                            enabled: true
                        }
                    }
                }
            }
        },
        series: [{
            name: 'A',
            data: [null, null, null, 7776, 567, 6.111, 11, 32, 110, 35, 369, 640,
                   105, 1436, 203, 3057, 4618, 6444, 9822, 1548, 2034, 2126,
                   2737, 2959, 3156, 3982, 2040, 3233, 2924, 2742, 26662,
                   2656, 2712, 2899, 2865, 2726, 2559, 2572, 2486, 2605,
                   2434, 2364, 2378, 2499, 2457, 2427, 2401, 244, 3586,
                   2230, 2004, 1787, 1447, 3076, 1555, 1144, 1109, 1950,
                   1087, 1084, 1057, 1057, 1075, 1421, 1358, 1025, 1014]
        }, {
            name: 'B',
            data: [null, null, null, null, null, 2223, 4333, 223, 344, 3112,
                   5, 25, 50, 120, 150, 200, 426, 60, 869, 1060, 1605, 2471, 3322,
                   428, 5221, 619, 4089, 8339, 999, 1038, 11643, 1392, 1478,
                   1515, 1785, 1955, 21205, 2344, 5393, 27935, 0062, 3049,
                   3352, 3804, 3431, 39197, 4500, 4300, 41000, 3000, 3000,
                   3000, 3000, 3100, 2000, 2700, 25000, 24000, 2300, 2000,
                   2100, 2000, 1900, 1800, 1800, 17000, 1600]
        }, {
            name: 'C',
            data: [null, 2131, 3553, 1552, 3523, 2355, 2323, 5522, 3122, 3235,
                   115, 1125, 1150, 11120, 11150, 1200, 1146, 6160, 1869, 1100, 1105, 1271, 1322,
                   1423, 15221, 629, 7089, 8339, 399, 1038, 1143, 1392, 1478,
                   11515, 11785, 11955, 12205, 2344, 2533, 2795, 3002, 3209,
                   13352, 13504, 13731,13997, 14500, 14300, 14100, 11390, 13700,
                   13500, 13300, 13100, 12900, 12700, 2500, 12400, 13000, 12000,
                   12100, 12000, 11900, 1800, 11800, 11700, 11600]
        }]
    });
});
</script>
</body>
</html>
Posted on Utopian.io - Rewarding Open Source Contributors
Thank you for the contribution. It has been approved.
You can contact us on Discord.
[utopian-moderator]
Taken from https://www.highcharts.com/demo/area-basic
There are changes made but the main point is the same. The tutorials are also very similar and they create tutorials for every kind of charts the library supports.
You can contact us on Discord.
[utopian-moderator]
Hey @jubi I am @utopian-io. I have just upvoted you!
Achievements
Suggestions
Get Noticed!
Community-Driven Witness!
I am the first and only Steem Community-Driven Witness. Participate on Discord. Lets GROW TOGETHER!
Up-vote this comment to grow my power and help Open Source contributions like this one. Want to chat? Join me on Discord https://discord.gg/Pc8HG9x