使用hcharts创建3D气泡图/How to use hcharts to make a 3D bubble chart
Summary:
Javascript has a lot of open source chart Libraries,Hcharts.js is one of them,today i will show you how to create a 3D bubble chart by Hcharts.
Javascript 有很多开源图表库,Hcharts.js就是其中之一,今天教程将教大家如何使用Hcharts.js去绘制一张3D气泡图。
- 兼容浏览器:IE, Chrome,Firefox等等
您能从本教程学到什么?
- 代码整体结构
- 怎么调用hcharts.js
- 怎么设置图表画布大小以及图表chart配置
- 怎么设置图表主副标题
- 怎么设置X、Y轴
- 怎么设置数据列(数据和颜色)
需要的准备条件
- 你需要一个代码编辑器,比如atom,EmEditor等等,当然因为是文本编辑,可以直接通过浏览器打开,typora这类文本编辑器也可以进行代码编辑。
- 你需要下载hcharts.js(如果不下载到本地,也可以在线调用,参考要点2.)
本教程难度
相对来说比较简单,只需要对固定代码格式有些简单了解,就可以绘制3D气泡图。
- 认识简单代码
- 认识简单英文
教程内容
下面请先看一个简单例子:
要点1:代码整体结构
<html>
<head>
<meta charset="utf-8">
<title>title</title>
<script src="https://img.hcharts.cn/jquery/jquery-1.8.3.min.js"></script>
<script src="https://img.hcharts.cn/highcharts/highcharts.js"></script>
<script src="https://img.hcharts.cn/highcharts/highcharts-more.js"></script>
<script src="https://img.hcharts.cn/highcharts/modules/exporting.js"></script>
<script src="https://img.hcharts.cn/highcharts-plugins/highcharts-zh_CN.js"></script>
</head>
<body>
<div id="container" style="min-width: 310px; height: 400px; margin: 0 auto"></div>
<script>
    $(function () {
        $('#container').highcharts({
       //key code
        })
//hcharts.js  code area!
</script>
</body>
</html>
html结构,我们创建图表的代码是js语句,所以关键代码是放在< script>里面。下面将详细讲解关键代码。
要点2:怎么调用hcharts.js
<script src="https://img.hcharts.cn/jquery/jquery-1.8.3.min.js"></script>
<script src="https://img.hcharts.cn/highcharts/highcharts.js"></script>
<script src="https://img.hcharts.cn/highcharts/highcharts-more.js"></script>
<script src="https://img.hcharts.cn/highcharts/modules/exporting.js"></script>
<script src="https://img.hcharts.cn/highcharts-plugins/highcharts-zh_CN.js"></script>
如果本地没有hcharts.js库,可以使用其在线js资源,同时需要加载jquery.min.js。直接在head区域引用就可以了。
要点3:怎么设置图表画布大小
<div id="container" style="min-width:400px;height:400px"></div>
在body区域,编辑chartjs代码之前,需要先定义下图表的大小。上面代码定义,最小宽度为400px,高为400px
    chart: {
            type: 'bubble',
            plotBorderWidth: 2,
            zoomType: 'xy'
        },
type:图表 类型,默认是line,这里是气泡图,所以设置为bubble。
plotBorderWidth:图表边框宽度,实例如下:
zoomType:缩放,xy表示,xy轴均可缩放,其余参数为,x或者y。 实例如下:
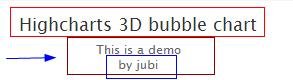
要点5:怎么设置图表主副标题
  title: {
            text: 'Highcharts 3D bubble chart'
        },
        subtitle: {
            text: 'This is a demo <br/>by jubi'
        },
title:主标题 ,在text后面输入标题文本,支持html标签。
subtitle: 副标题,在text后面输入文本,支持html标签。实例如下:
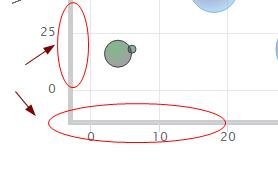
要点6:怎么设置X、Y轴
   xAxis: {
            gridLineWidth: 1,
            title:{text:'x_title'},
        },
title:设置x轴标题,显示在x轴下方。
gridLineWidth:网格线宽度。 实例如下:
其余刻度参数,不设置即为默认参数,也就是使用数据的x参数。
  yAxis: {
            title:{text:'y_title'},
            startOnTick: false,
            endOnTick: false
        },
title:设置y轴标题,显示在y轴下方。
startOnTick:是否强制轴以刻度开始
endOnTick:是否强制轴以刻度结束
要点7:怎么设置数据列(数据和颜色)
 series: [{
            name:'bubble1',
            data: [
                [9, 81, 63],
                [98, 5, 89],
                [51, 50, 73],
                [41, 22, 14],
                [58, 24, 20],
                [78, 37, 34],
                [55, 56, 53],
                [18, 45, 70],
                [42, 44, 28],
                [3, 52, 59],
                [31, 18, 97],
                [79, 91, 63],
                [93, 23, 23],
                [44, 83, 22]
            ],
            marker: {
                fillColor: {
                    radialGradient: { cx: 0.4, cy: 0.3, r: 0.7 },
                    stops: [
                        [0, 'rgba(15,15,115,0.5)'],
                        [1, Highcharts.Color(Highcharts.getOptions().colors[0]).setOpacity(0.5).get('rgba')]
                    ]
                }
            }
        }
name:数据名称
data:具体数据,格式为 data:[[datax,datay,dataz],[data1x,data1y,data1z],……] 前2个数值对应于xy轴,第三个数值对应于气泡大小。
marker: {
   fillColor: {
      radialGradient: { cx: 0.4, cy: 0.3, r: 0.7 },
      stops: [
         [0, 'rgba(255,255,255,0.5)'],
         [1, Highcharts.Color(Highcharts.getOptions().colors[0]).setOpacity(0.5).get('rgba')]
      ]
   }
}
这是设置气泡渐变颜色,让气泡看起来有3d效果。
radialGradient:环形渲染
- (cx,cy)为最下层(最外层)
- r 为最内层和最外层(最上层和最下层)渐变半径
< stop> 标签定义了梯度停点(渐变点) 颜色是使用rgba颜色,例如rgba(255,255,255,0.5),末位0.5 是颜色透明度。
完整实例如下:
完整代码如下:
<html><head>
<meta charset="utf-8">
    <title>3D bubble chart</title>
    <script src="https://img.hcharts.cn/jquery/jquery-1.8.3.min.js"></script>
    <script src="https://img.hcharts.cn/highcharts/highcharts.js"></script>
    <script src="https://img.hcharts.cn/highcharts/highcharts-more.js"></script>
    <script src="https://img.hcharts.cn/highcharts/modules/exporting.js"></script>
    <script src="https://img.hcharts.cn/highcharts-plugins/highcharts-zh_CN.js"></script>
</head>
<body>
<div id="container" style="min-width:400px;height:400px"></div>
    <script>
    $(function () {
    $('#container').highcharts({
        chart: {
            type: 'bubble',
            plotBorderWidth: 1,
            zoomType: 'xy'
        },
        title: {
            text: 'Highcharts 3D bubble char<br/>This is a demo'
        },
        xAxis: {
            gridLineWidth: 1
        },
        yAxis: {
            startOnTick: false,
            endOnTick: false
        },
        series: [{
            name:'bubble1',
            data: [
                [9, 81, 63],
                [98, 5, 89],
                [51, 50, 73],
                [41, 22, 14],
                [58, 24, 20],
                [78, 37, 34],
                [55, 56, 53],
                [18, 45, 70],
                [42, 44, 28],
                [3, 52, 59],
                [31, 18, 97],
                [79, 91, 63],
                [93, 23, 23],
                [44, 83, 22]
            ],
            marker: {
                fillColor: {
                    radialGradient: { cx: 0.4, cy: 0.3, r: 0.7 },
                    stops: [
                        [0, 'rgba(5,255,255,0.5)'],
                        [1, Highcharts.Color(Highcharts.getOptions().colors[0]).setOpacity(0.5).get('rgba')]
                    ]
                }
            }
        },
                 {
                     name:'bubble2',
                     data: [
                         [9, 82, 63],
                         [98, 5, 89],
                         [52, 50, 73],
                         [26, 22, 12],
                         [58, 27, 20],
                         [78, 37, 32],
                         [55, 56, 53],
                         [28, 25, 70],
                         [22, 22, 28],
                         [3, 52, 59],
                         [32, 28, 97],
                         [79, 32, 63],
                         [93, 2, 2],
                         [6, 83, 23]
                     ],
                     marker: {
                         fillColor: {
                             radialGradient: { cx: 0.5, cy: 0.2, r: 0.5 },
                             stops: [
                                 [0, 'rgba(205,15,25,0.5)'],
                                 [1, Highcharts.Color(Highcharts.getOptions().colors[0]).setOpacity(0.4).get('rgba')]
                             ]
                         }
                     }
                 },
                 {
                     name:'bubble3',
                     data: [
                         [62, 38, 20],
                         [6, 28, 2],
                         [2, 93, 55],
                         [57, 2, 90],
                         [80, 76, 22],
                         [22, 76, 96],
                         [88, 56, 20],
                         [30, 67, 69],
                         [57, 62, 98],
                         [6, 26, 26],
                         [66, 20, 22],
                         [22, 87, 89],
                         [57, 92, 82],
                         [65, 25, 98]
                     ],
                     marker: {
                         fillColor: {
                             radialGradient: { cx: 0.4, cy: 0.3, r: 0.7 },
                             stops: [
                                 [0, 'rgba(1,5,255,0.1)'],
                                 [1, Highcharts.Color(Highcharts.getOptions().colors[1]).setOpacity(0.5).get('rgba')]
                             ]
                         }
                     }
                 }]
    });
});
</script>
</body></html>
Posted on Utopian.io - Rewarding Open Source Contributors
Thank you for the contribution. It has been approved.
You can contact us on Discord.
[utopian-moderator]
Hey @jubi I am @utopian-io. I have just upvoted you!
Achievements
Suggestions
Get Noticed!
Community-Driven Witness!
I am the first and only Steem Community-Driven Witness. Participate on Discord. Lets GROW TOGETHER!
Up-vote this comment to grow my power and help Open Source contributions like this one. Want to chat? Join me on Discord https://discord.gg/Pc8HG9x