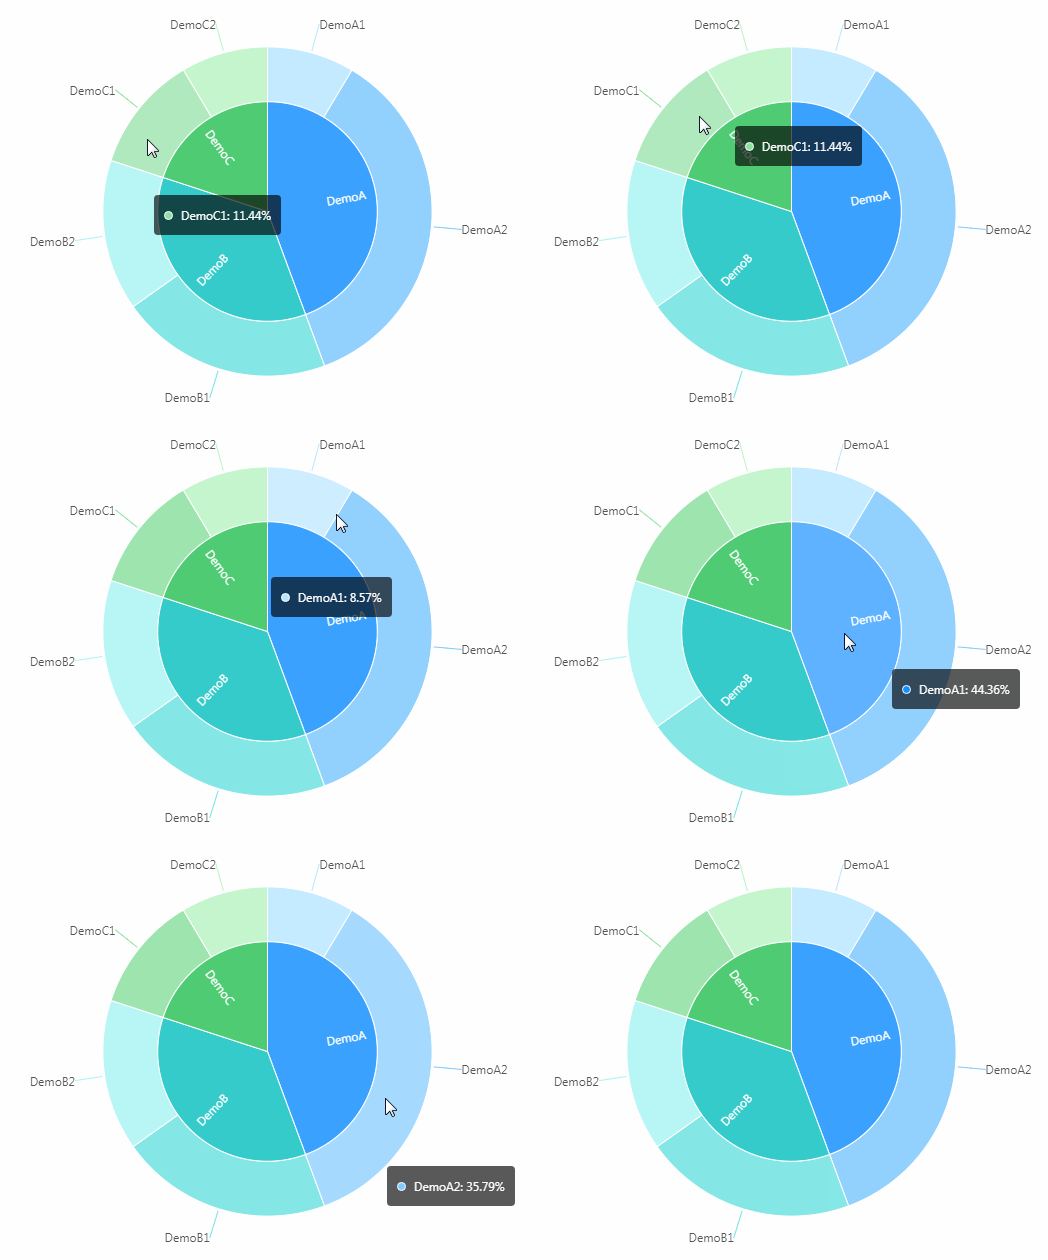
使用G2创建多层饼图/How To Use G2 To Make MultiPie Chart
Summary:
G2 is a set of graphically-based graphical syntax that is data-driven and highly user-friendly and extensible, allowing users to build a wide variety of interactive statistics without having to worry about detailed implementation details chart.
G2 是一套基于可视化编码的图形语法,以数据驱动,具有高度的易用性和扩展性,用户无需关注各种繁琐的实现细节,一条语句即可构建出各种各样的可交互的统计图表。
您将从这个教程中学到什么
- 如何引入js文件
- 如何定义容器
- 如何定义数据
- 如何引用数据
- 如何定义提示框
- 如何渲染图表
学习此教程的必备条件
教程难度
- 容易
教程内容
演示效果

1. 知识点A - 如何引入js文件
<script src="https://gw.alipayobjects.com/os/antv/assets/g2/3.0.4-beta.2/g2.min.js"></script>
<script src="https://gw.alipayobjects.com/os/antv/assets/data-set/0.8.3/data-set.min.js"></script>
使用内嵌script对js文件进行引入,用于后期图表使用。
2. 知识点B - 如何定义容器
<div id="multipie"></div>
使用div定义容器,用于展示图表。容器名:multipie。
3. 知识点C - 如何定义数据
  const { DataView } = DataSet;
  const data = [
    { value: 251, type: 'DemoA', name: 'DemoA1' },
    { value: 1048, type: 'DemoA', name: 'DemoA2' },
    { value: 610, type: 'DemoB', name: 'DemoB1' },
    { value: 434, type: 'DemoB', name: 'DemoB2' },
    { value: 335, type: 'DemoC', name: 'DemoC1' },
    { value: 250, type: 'DemoC', name: 'DemoC2' }
  ];
- const: 用于定义数组。
- data:定义为数组名。
- 格式:{ value:饼图占比值, type:'主分类', name:'子分类'
4. 知识点D - 如何引用数据
  const dv = new DataView();
  dv.source(data).transform({
    type: 'percent',
    field: 'value',
    dimension: 'type',
    as: 'percent'
  });
  const chart = new G2.Chart({
    container: 'multipie',
    forceFit: true,
    height: window.innerHeight,
    padding: 0
  });
  chart.source(dv, {
    percent: {
      formatter: val => {
        val = (val * 100).toFixed(2) + '%';
        return val;
      }
    }
  });
- dv.source:定义载入数据。
- type:属性为percent,表示使用百分比。
- dimension:定义统计维度的字段。
- container:定于数据从multipie数组取值。
- forceFit: 定义图表的宽度自适应开关,默认为 false,设置为 true 时表示自动取 dom(实例容器)的宽度。
- height: 定义图表高度。
- window.innerHeight: 获取页面可用高度。
- source:定义为chart装载数据,返回chart对象。
5. 知识点E - 如何定义提示框
  chart.tooltip({
    showTitle: false,
    itemTpl: '<li><span style="background-color:{color};" class="g2-tooltip-marker"></span>{name}: {value}</li>'
  });
  chart.legend(false);
  chart.intervalStack()
    .position('percent')
    .color('type')
    .label('type', {
      offset: -10
    })
    .tooltip('name*percent', (item, percent) => {
      percent = (percent * 100).toFixed(2) + '%';
      return {
        name: item,
        value: percent
      };
    })
    .select(false)
    .style({
      lineWidth: 1,
      stroke: '#fff'
    });
- tooltip:图表的tooltip配置,G2图表的tooltip使用html渲染。
- itemTpl:定义提示样式。
- legend: 配置图表图例。
- color: 定义颜色。
- label: 定义文本。
6. 知识点F - 如何渲染图表
  const outterView = chart.view();
  const dv1 = new DataView();
  dv1.source(data).transform({
    type: 'percent',
    field: 'value',
    dimension: 'name',
    as: 'percent'
  });
  outterView.source(dv1, {
    percent: {
      formatter: val => {
        val = (val * 100).toFixed(2) + '%';
        return val;
      }
    }
  });
  outterView.coord('theta', {
    innerRadius: 0.5 / 0.75,
    radius: 0.75
  });
  outterView.intervalStack()
    .position('percent')
    .color('name', [ '#BAE7FF', '#7FC9FE', '#71E3E3', '#ABF5F5', '#8EE0A1', '#BAF5C4' ])
    .label('name')
    .tooltip('name*percent', (item, percent) => {
      percent = (percent * 100).toFixed(2) + '%';
      return {
        name: item,
        value: percent
      };
    })
    .select(false)
    .style({
      lineWidth: 1,
      stroke: '#fff'
    });
  chart.render();
- chart.view:创建视图,返回view对象。
- type:属性为percent,表示使用百分比。
- dimension:定义统计维度的字段。
- coord:设置坐标系类型,同时允许进行各种坐标系变换,默认为笛卡尔坐标系。
- render:用于将图表渲染至画布。
完整代码
<html lang="en">
<head>
    <meta charset="UTF-8">
    <title>多层饼图</title>
</head>
<body>
<div id="multipie"></div>
<script src="https://gw.alipayobjects.com/os/antv/assets/g2/3.0.4-beta.2/g2.min.js"></script>
<script src="https://gw.alipayobjects.com/os/antv/assets/data-set/0.8.3/data-set.min.js"></script>
<script>
  const { DataView } = DataSet;
  const data = [
    { value: 251, type: 'DemoA', name: 'DemoA1' },
    { value: 1048, type: 'DemoA', name: 'DemoA2' },
    { value: 610, type: 'DemoB', name: 'DemoB1' },
    { value: 434, type: 'DemoB', name: 'DemoB2' },
    { value: 335, type: 'DemoC', name: 'DemoC1' },
    { value: 250, type: 'DemoC', name: 'DemoC2' }
  ];
  const dv = new DataView();
  dv.source(data).transform({
    type: 'percent',
    field: 'value',
    dimension: 'type',
    as: 'percent'
  });
  const chart = new G2.Chart({
    container: 'multipie',
    forceFit: true,
    height: window.innerHeight,
    padding: 0
  });
  chart.source(dv, {
    percent: {
      formatter: val => {
        val = (val * 100).toFixed(2) + '%';
        return val;
      }
    }
  });
  chart.coord('theta', {
    radius: 0.5
  });
  chart.tooltip({
    showTitle: false,
    itemTpl: '<li><span style="background-color:{color};" class="g2-tooltip-marker"></span>{name}: {value}</li>'
  });
  chart.legend(false);
  chart.intervalStack()
    .position('percent')
    .color('type')
    .label('type', {
      offset: -10
    })
    .tooltip('name*percent', (item, percent) => {
      percent = (percent * 100).toFixed(2) + '%';
      return {
        name: item,
        value: percent
      };
    })
    .select(false)
    .style({
      lineWidth: 1,
      stroke: '#fff'
    });
  const outterView = chart.view();
  const dv1 = new DataView();
  dv1.source(data).transform({
    type: 'percent',
    field: 'value',
    dimension: 'name',
    as: 'percent'
  });
  outterView.source(dv1, {
    percent: {
      formatter: val => {
        val = (val * 100).toFixed(2) + '%';
        return val;
      }
    }
  });
  outterView.coord('theta', {
    innerRadius: 0.5 / 0.75,
    radius: 0.75
  });
  outterView.intervalStack()
    .position('percent')
    .color('name', [ '#BAE7FF', '#7FC9FE', '#71E3E3', '#ABF5F5', '#8EE0A1', '#BAF5C4' ])
    .label('name')
    .tooltip('name*percent', (item, percent) => {
      percent = (percent * 100).toFixed(2) + '%';
      return {
        name: item,
        value: percent
      };
    })
    .select(false)
    .style({
      lineWidth: 1,
      stroke: '#fff'
    });
  chart.render();
</script>
</body>
</html>
最终效果

系列课程
- 如果您喜欢我的教程,可以在我的个人档案页面,获取更多信息。
If you like my tutorial , You can check out your profile for more such tutorials. - 您可以使用zqz-tutorial标签快速查看我发布的所有教程
You can use the "zqz-tutorial" tag to see all the tutorials I've posted.
Posted on Utopian.io - Rewarding Open Source Contributors
Your contribution cannot be approved because it does not follow the Utopian Rules.
Not original.
You can contact us on Discord.
[utopian-moderator]