Visualising Drupal Security Advisory Data
Drupalgeddon 2.0 brought a lot of focus on the Drupal security initiative and its practices. The way the security team was proactive with respect to disclosure, the way it was communicated to the developers, community and press was commendable. In addition to all these the communication was continuous and all the stake holders were updated with the latest status of the vulnerability and how it needs to be addressed.
Scope of Analysis
After the patches were applied to all the websites that we maintain at Valuebound we thought of spending some more time on security advisories and see their distribution across categories and years. So we have analysed the security advisories that are available on https://www.drupal.org/security starting with 1 Dec 2005.
Tools
- Google spreadsheets along with IMPORTXML formula.
- Power BI.
Results
We wanted to do a basic analysis of how Security Advisories have been released till date and what were the security scores of each of these advisories. Though official Security track record has some details it was not up to date and it was not detailed enough. So we set out to gather the data. Though there were API endpoints like
https://www.drupal.org/api-d7/node.json?type=sa&status=1
https://www.drupal.org/api-d7/node.json?taxonomy_forums=1852
https://www.drupal.org/api-d7/node.json?taxonomy_forums=1856
we felt it was too much of work to normalise the data from these endpoints. So we took a different approach of scraping the data from https://www.drupal.org/security. It was not a straight forward job and it was not as easy as we initially we thought it would be. We took the route of scraping https://www.drupal.org/security using our good old Google docs and some queries.
We used
=IMPORTXML("https://www.drupal.org/security","//*[contains(@class, 'node-readmore')]//a/@href")
for getting the list of all the security advisories.
Once we had the list of links populated in Google spreadsheet we used IMPORTXML formula on each of them to get the relevant data. Since the data was inconsistent we had to use different queries based on the different time windows during which these announcements were made. After doing an initial round of scraping we did some data manipulations to get all the relevant data in the format we wanted. You can checkout the default data and the cleaned up data
The next challenge was that two different approaches were used in categories the vulnerabilities. Post August 6th, 2014 NIST Common Misuse Scoring System (NISTIR 7864) mechanism was used for categorizing the vulnerabilities and scoring them. So that data was better structured. Before that Drupal team had its own way of classifying the vulnerabilities.
You can read about them here - https://www.drupal.org/drupal-security-team/security-risk-levels-defined
To have some meaninful insights we wanted to have the security risk score for vulnerabilities that were reported prior to August 6th, 2014. So based on the new guidelines and the security risk level assigned to the vulnerabilities announced before the date we did a reverse mapping.
For highly critical we gave a rating of 22.5, Critical we gave 17, Moderately Critical we gave 12, Less Critical we gave 7 and Not Critical we gave 2.
Though these numbers are not accurate this gives us a broad sense. To have an exact scoring we will need to have a rating for each of the six Risk metrics defined in NISTIR 7864. This can be time consuming and hence we put it on hold for now. It would be great if somebody can rate the old SAs as per the new guidelines. If you would like to take a dig at it you are free to do it here - Drupal core vulnerability analysis. All users have edit access. So please go ahead and update the Columns H to M that are marked in orange and have the text “Details not available”. Once you are done with it you can also update the column G and you can use these values in https://security.drupal.org/riskcalc to find out the Risk Score.
With the currently available data we made some visualizations.
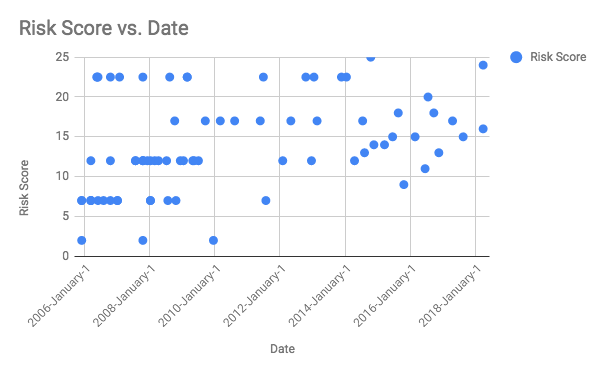
This was created using Google spreadsheet. As you can see the number of SAs have reduced over the time and it is specially interesting note that vulnerabilities with score less than 10 have reduced drastically post January 2010. I am not sure if this could be attributed to automation tools that were around that time.
Using the data from Google spreadsheets we created a couple of interactive maps in PowerBI.
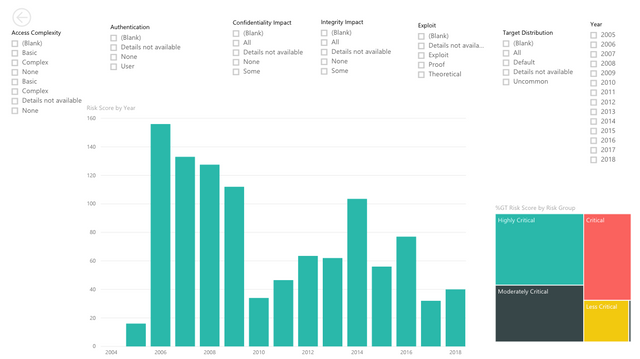
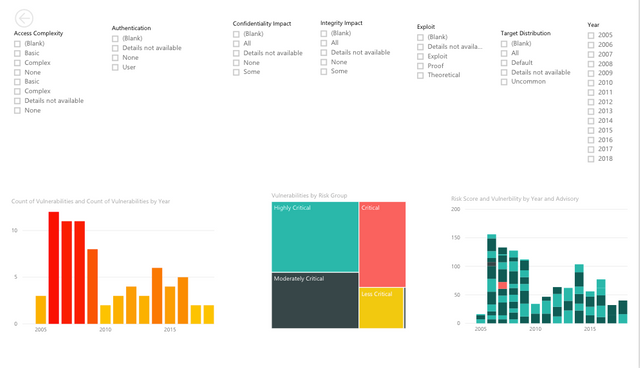
You can check out these interactive maps here.
If anybody would like to continue the analysis I can share the PowerBi File (pbix) with you. Feel free to ping me on gokulnk#4937
Dear @gokulnk, great work visualizing the CVE severity scores of drupal over time! However, I'm sorry, but I can't approve that for utopian for the following reasons:
Need help? Write a ticket on https://support.utopian.io.
Chat with us on Discord.
[utopian-moderator]
Thanks for the feedback. No issues. I hope Utopian opens up for non github open-source projects as well. I will be updating the post with some more analysis that I am working on.
Thanks @gokulnk, looking forward to more analysis posts from you! If you have doubts about what is suitable for utopian, feel free to contact me/us on discord. See the link in my original reply - Cheers!
Congratulations @gokulnk! You have completed some achievement on Steemit and have been rewarded with new badge(s) :
Click on any badge to view your Board of Honor.
For more information about SteemitBoard, click here
If you no longer want to receive notifications, reply to this comment with the word
STOPDo not miss the last announcement from @steemitboard!
Great Jobs on this post! My New Bots Just gave you a free upvote! mcg6000(.)com/booster