Simulation and control of a physical system using MyOpenLab.
What Will I Learn?
Use the tools of the MyOpenLab program.
Know the programming G.
Program using functional blocks.
Simulate and control a physical system.
Requirements
Installing the myopenlab software
Knowledge about a functional block
Programming knowledge.
Difficulty
- Basic
Tutorial Contents
Greetings, this is a contribution from the @edagmi account for the utopian community. The following tutorial is focused on the simulation and control of a physical system, using MyOpenLab, which consists of Open Source software, which can be used as a developer for a large number of applications in different areas.

The programs of great potential that exist in the market for simulation and control applications, are tools with licenses with restrictions of use and high cost. MyOpenLab competes with this type of applications, using a specific programming language oriented to connection blocks. The programming language of MyOpenLab, is based on JAVA to create a large number of functions that represent the connection blocks. The connection blocks use the graphical programming or programming G, to define the algorithms that require the applications to develop.
MyOpenLab also presents the possibility of connecting with the physical world, to create measurement systems for educational and industrial purposes, through interfaces with the Arduino and Raspberry cards, which also present Open Source platforms.
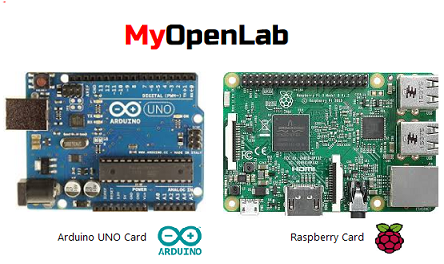
Next we will describe a series of steps that will allow us to know the environment of the MyOpenLab, its functional blocks and we will generate an application that describes the execution of a program.
Step 1:
When you open the MyOpenLab program, you can see the main window of the program, where you can recognize the following tools:
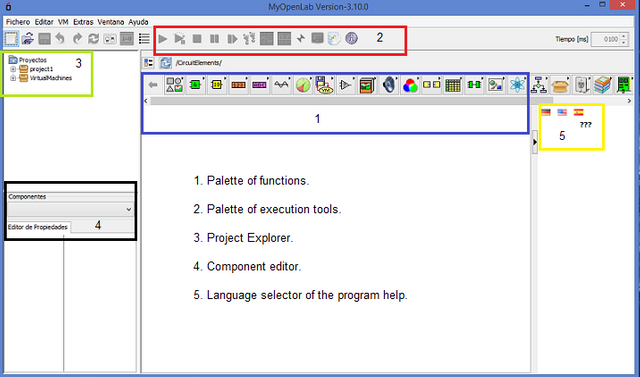
Step 2:
In the explorer of the project located on the left side of the window, as shown in the figure, we select a new project to execute, the project is named and a file with the extension .vlogic is displayed. In this file are the programming panels of the application.
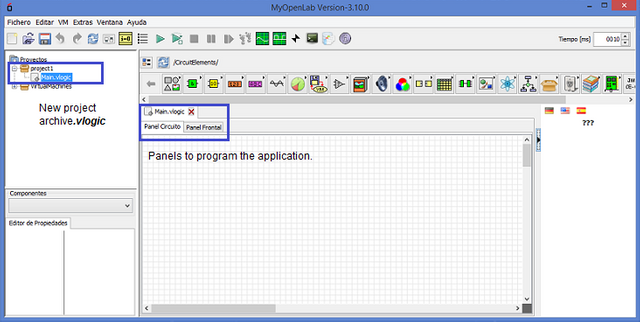
Step 3:
The Main.vlogic file is recognized, it is formed by two windows called front panel and circuit panel, both panels are complemented to create the visual interface and the graphic code of the application programming. In the following figure both panels are observed.
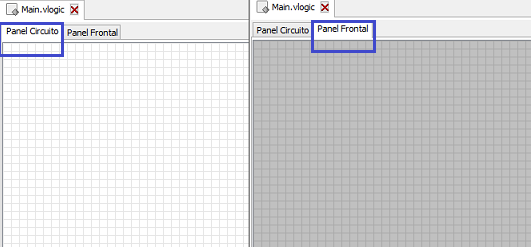
Step 4:
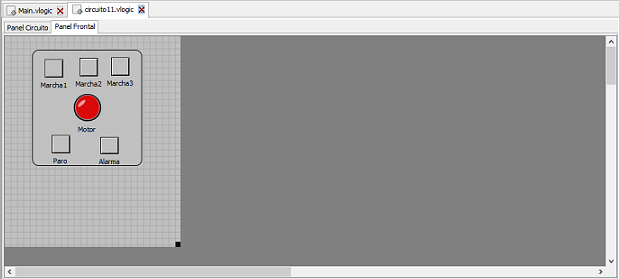
We observe the front panel and the tool palettes, the panel is used to show the elements that will serve as data entry and data output of the program, that is, it is the interface between the program and the user. Only objects are located on this front panel and it does not present a programming code. In the following figure, there is a front panel extracted from the examples of the program.
The tool palette contains all the objects that you want to use in the interface with the user, these objects are used to enter data and display data in the development of the application, each object is related to a data type, the most common being: Numeric, Boolean and character string. In the following image, the tool palette of the front panel is shown:

Step 5:
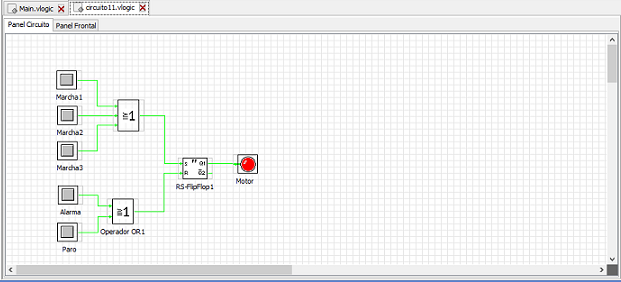
The circuit panel, is used to show the programming functions in block that uses the data entered in the front panel, there is the programming code of the application. On the circuit panel, the input data is processed and the output data is sent to the front panel. The following figure shows the circuit panel extracted from the examples of the program.
The tool palette of the circuit panel contains all the functional blocks that are used to generate the programming code of the application. Although the functional blocks are programmed in JAVA, the programming structure is based on Graphical or G programming. In the figure shown below, you can see the tool panel of the circuit panel.

Step 6:
We make an application to program both panels and test the execution process of the application.
Application for filling a tank:
Control the level of filling of a tank for a desired value, activating an alarm for levels above the desired value.
The steps below are based on developing the application.
Step 7:
In the tool palette of the front panel, we look for the following numerical elements for the interface of the application, as shown in the following figure:
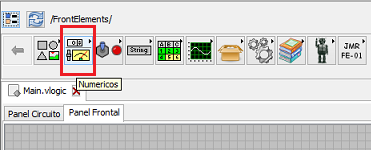
For data entry, the following will be used:
- A numerical potentiometer to control the level of the tank.
- A numerical constant to indicate the desired value of the tank filling.
In the following figure, the elements that represent the potentiometer and the numerical constant are shown:
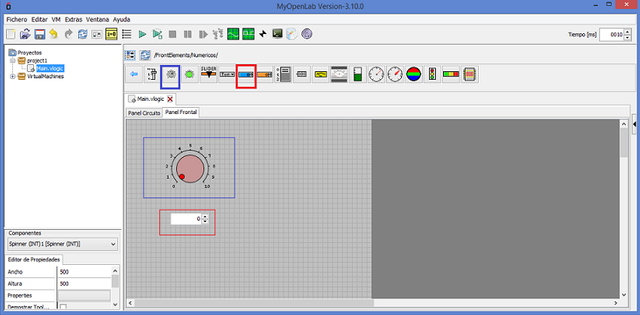
For data output we will use:
- A numerical indicator that serves as a level indicator of a tank.
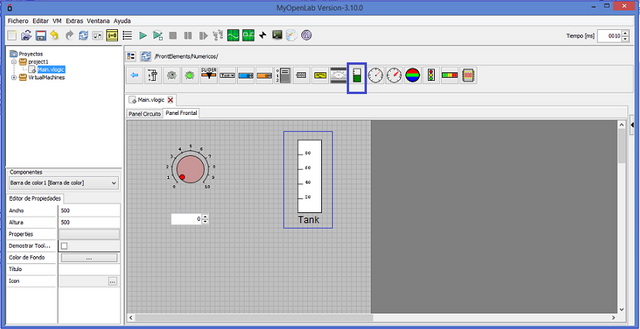
- A Led indicator that serves as an alarm indicator for a level above the maximum capacity of the tank. In the following figure, the elements for the display of the tank filling are shown:
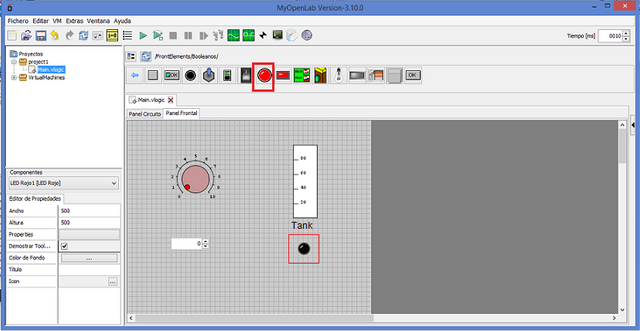
Step 8:
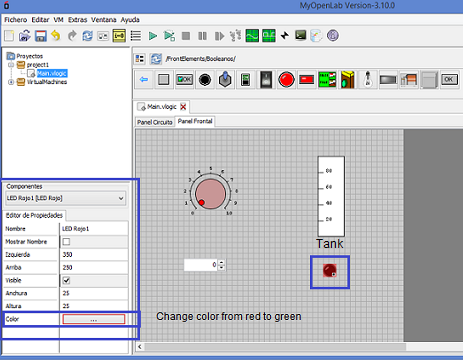
We change the properties of the objects that need to be modified. This is done by selecting the component and modifying its properties in the component editor, as shown in the following figure. In the case of tank application, the activation color of the LED alarm is changed from red to green.
Step 9:
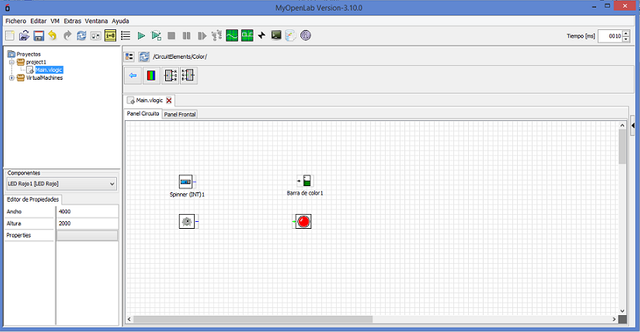
We identify in the circuit panel the variables that were placed on the front panel and that will be linked to the programming functions to meet the requirements of the tank application.
Step 10:
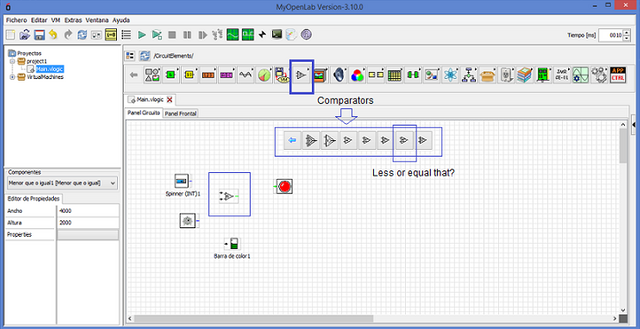
We select in the function palette of the circuit panel, the numerical comparison function, which is used to determine the relationship between the level measured in the tank and the desired level. You must select the comparators and then proceed to find the comparator of lesser or equal, as shown in the following figure.
Step 11:
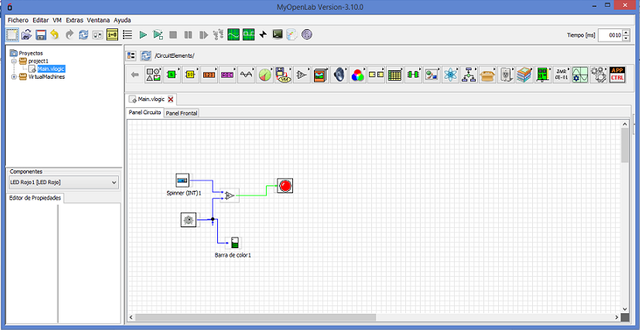
The blocks of each element of the circuit panel present data input and data output terminals, which serve as a data flow to interconnect with the other variables and functions. Each one of the terminals is connected according to the logic of the application that is, to compare the input data for the level of the tank, plot the level of the tank and use the comparator output to activate the alarm. The code is seen in the following figure.
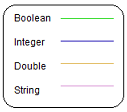
The wires that connect the data assume the colors of the type of data they handle in their respective link. To have a reference of this we can observe the following image:
Step 12:
We select in the execution palette the button to run the program, to proceed to execute the application of the tank, we observe the following figure.
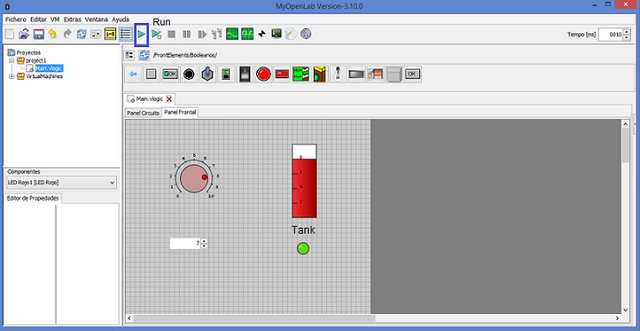
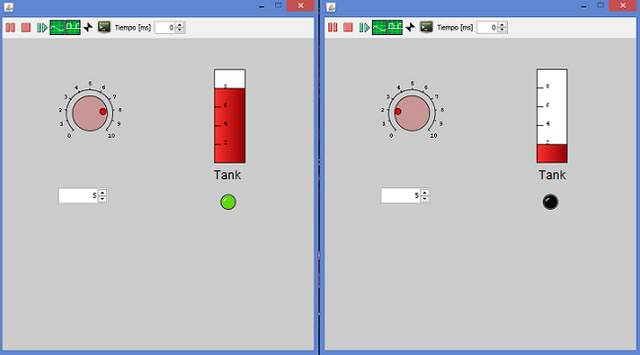
Step 13: Finally, the behavior of the tank application is verified, based on the programming done on the circuit panel. For the values below and above the desired tank level value, the display alarm is activated, thus checking the logical operation of filling the tank, as shown in the following figure:
Thank you for your attention I hope this material helps you, see you in a next tutorial.
Posted on Utopian.io - Rewarding Open Source Contributors
if you want more upvotes check out my last blog post @a-0-0
Congratulations! This post has been upvoted from the communal account, @minnowsupport, by edagmi from the Minnow Support Project. It's a witness project run by aggroed, ausbitbank, teamsteem, theprophet0, someguy123, neoxian, followbtcnews, and netuoso. The goal is to help Steemit grow by supporting Minnows. Please find us at the Peace, Abundance, and Liberty Network (PALnet) Discord Channel. It's a completely public and open space to all members of the Steemit community who voluntarily choose to be there.
If you would like to delegate to the Minnow Support Project you can do so by clicking on the following links: 50SP, 100SP, 250SP, 500SP, 1000SP, 5000SP.
Be sure to leave at least 50SP undelegated on your account.
Your contribution cannot be approved because it does not follow the Utopian Rules.
You can contact us on Discord.
[utopian-moderator]