Utopian Top Projects - A Closer Look - Blockchain Business Intelligence

Have you been to the top? Have you reached the pinnacle of success? How did it feel? To some it may be a dream, but to those who are afraid of heights, it's a nightmare.
In this analysis, this author took a closer look into Utopian's top projects.
Outline
- Criteria for Top
- Point System
- Scope of Analysis
- Growth Check
- Top Projects
- By Contributions
- By Payout and Rewards
- By Votes
- By Comments
- Results Tally
- By Total
- By Average
- Your Champion
1. Criteria for Top
To identify the top projects, this author decided to use a point system.
1.1. Point System
- Four categories of 'top' were considered: by contributions, by total rewards1, by number of votes, and by engagement (total comments)
- For each category, only the top 10 projects were included
- For each category, points were awarded to the top 5, none for the remaining
- 5 points for the top spot
- 4 points for the second
- 3 points for the third
- 2 points for the fourth
- 1 point for the fifth
- The total points for each category were tallied
- The projects were sorted in descending order based on the tallied points to determine their rank
1: All throughout this document, the term reward refers to the vote value given by @utopian-io to a contribution.
2. Scope of Analysis
- Contributions were acquired on Dec. 24, 2017 1100H UTC
- Data extracted was from
2017-09-28 1539H UTCto2017-12-24 0520H UTC - Down-votes were excluded
- Up-votes on comments were excluded
3. Growth Check

As of December 24, there were 895 authors rewarded, 1508 projects contributed, and 7555 contributions up-voted.
Let's compare November and December to determine its growth:
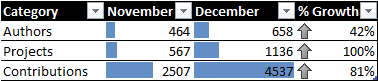
As of date, authors grew by 42%, projects by 100%, and contributions by 81%.
Let's look into the different categories to determine the top projects.
4. Top Projects
To determine the top projects for each category, two graphs were created at the beginning of each section:
- A bar chart (left) to get the total the count of the subject value (e.g., the sum of all contributions) per project, and
- A line chart (right) with a running total of the subject value through time
The reasons for creating these two charts were:
- To easily identify which projects got the most of the subject value (left), and
- To see how the subject value grew over time (right)
Let's see this applied on the first category.
4.1. By Contributions
 |  |
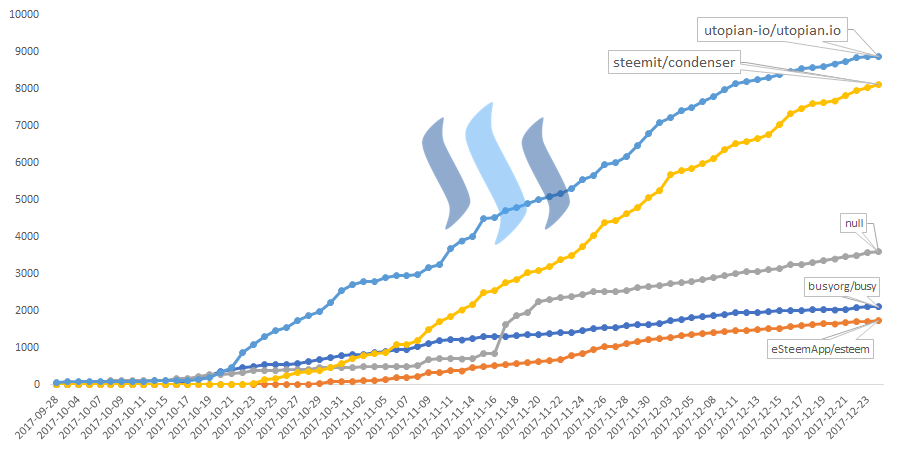
The message was the same for the two charts given: utopian-io/utopian.io and steemit/condenser led other projects by a large margin.
The bar chart (left) showed that there were close to 1000 contributions to utopian-io/utopian.io. Next to it was steemit/condenser with around 800.
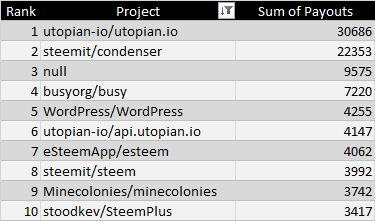
4.1.1. Result
Putting this into a table with the corresponding points:

utopian-io/utopian.io got the top spot for its 974 contributions.
The null project, mostly for blog entries, was skipped because it had no specific repository, thus was not rewarded any points; points were awarded to the succeeding projects. This rule was applied to the other categories as well, unless stated otherwise.
Let's look at the contributions for November and December.
4.1.2. A Look Into November and December
 |  |
They also gave the same message that utopian-io/utopian.io and steemit/condenser got the top two spots.
Let's look how many authors contributed to the projects.
4.1.3. Distinct Contributors

In utopian-io/utopian.io there were 290 distinct authors who made the 974 contributions.
Let's look into the next category.
4.3. By Payout and Reward
To reiterate:
- Payout is the value displayed as the contribution's payout value
- Reward is the up-vote value given by @utopian-io
Here's an image to illustrate:

First, let's look at the total rewards.
4.2.1. Total Rewards
 |  |
The bar chart (left) showed that utopian-io/utopian.io has generated close to $23K rewards. Next to it was steemit/condenser with more than $17K.
One thing became obvious - total rewards were tied to the number of contributions. Thus, the projects that will get the top positions from this category onward were projects that had the most number of contributions.
As such, the author tried to look at it from a different angle - by average reward per contribution for projects that had more than 10 contributions (the number 10 was chosen arbitrarily).
4.2.1.1. Rewards - A Different View
 |  |
The chart on the left showed that steemit/condenser and utopian-io/utopian.io were outliers when it comes to the number of contributions (y or vertical axis) and unique authors (x or horizontal axis).
What is an outlier?
a data point on a graph or in a set of results that is very much bigger or smaller than the next nearest data point. - source
The table on the right showed that when it comes to the average vote value ($), gornanization/1k got the top spot with an average of $59 per contribution. utopian-io/utopian.io and steemit/condenser were at the 80th and 86th spots, respectively, which gave out an average of $22 to $23 for each contribution.

To make it somehow fairer for other projects, the author decided to use the average value as the criterion to determine the top projects from hereon.
Let's now look into the total payouts.
4.2.2. Total Payout
 |  |
It looked the same with total rewards - utopian-io/utopian.io and steemit/condenser got the top two spots.
utopian-io/utopian.io has generated more than $30K total payout while steemit/condenser has generated more than $22K.
Let's look into the average payout.
4.2.2.1. By Average Payout

Minecolonies/minecolonies got the top spot with an average of $68 for each contribution.
4.2.3. Results
Here were the two tables for the results of average rewards and average payouts.
 |  |
gornanization/1k got the top spot for the average reward category, while Minecolonies/minecolonies got the top spot for the average payout category.
Let's now look into the total votes generated.
4.3. By Votes
 |  |
For this category, we see a large gap between utopian-io/utopian.io and steemit/condenser. The former accumulated a total of 43K votes while the latter got 29K. A 14K difference.

Looking at this on an average vote per contribution for projects that had more than 10 contributions.
4.3.1. By Average Number of Votes

The table showed that MattyIce/bottracker got the top spot with an average of 104 votes per contribution.
And for the last category, let's look into the comments.
4.4. By Comments
 |  |
Again, utopian-io/utopian.io and steemit/condenser got the top two spots for the totals category.
An interesting story here was the total comments for each project were close - 8894 comments for utopian-io/utopian.io and 8117 comments for steemit/condenser. This author also observed the gap shrinking in the growth chart (right).

Let's look at the average.
4.4.1. By Average Number of Comments

The table showed that MattyIce/bottracker got the top spot with an average of 23 comments per contribution.
Let's tally the results.
5. Results Tally
This author was divided whether to highlight the top projects based on total or by average. As such, he decided to show both and let you, the reader, decide your champion.
5.1. Tally By Total

This chart showed that utopian-io/utopian.io led all categories. Put this into a table:

And then tallied the results:

utopian-io/utopian.io got the top spot for all categories garnering a total of 25 points.
5.2. Tally By Average
Here were the tally of the results for the average.

MattyIce/bottracker got the top spot by garnering a total of 12 points. This project got the top spot for two categories: Ave. # of Votes and Ave. # of Comments.
5.3. Your Champion
If you chose the total as your criterion to determine your winner, then your champion is utopian-io/utopian.io.
However, if you choose the average as your criterion to determine your winner, then your champion is MattyIce/bottracker.
This author lets you - the reader - decide.
Tools Used
Source Code
Codes used to extract data for this analysis are available in Github:
https://github.com/eastmaels/biutopian
I am part of a Blockchain Business Intelligence community. We all post under the tag #BlockchainBI. If you have an analysis you would like carried out on Steemit or Blockchain data, please do contact me or any of the#BlockchainBI team and we will do our best to help you...
You can find #blockchainbi on discord https://discordapp.com/invite/JN7Yv7j
Posted on Utopian.io - Rewarding Open Source Contributors
love this post, sorry I missed it for the upvote
No worries. The intention's there. :) An analysis is still under way. Still gathering the data for it. It needs a before and after snapshots of the Steeem blockchain. (I'm not aware if there's such a tool where one can take a before and after snapshots of the blockchain.)
you would need to take your own snapshot of before and after
Noted. Thank you.
Hey @eastmael I am @utopian-io. I have just upvoted you!
Achievements
Community-Driven Witness!
I am the first and only Steem Community-Driven Witness. Participate on Discord. Lets GROW TOGETHER!
Up-vote this comment to grow my power and help Open Source contributions like this one. Want to chat? Join me on Discord https://discord.gg/Pc8HG9x
Thank you.
Thank you for your contribution. It has been approved.
You can contact us on Discord.
[utopian-moderator]
Thank you. Happy holidays!