"Steemit Top Ten Tags Behavior Analysis" : Witnessing how Steemit's Top 10 Tags Behave | A Weekly Report and Data Comparison (2nd Week)
Greetings! Welcome to our 2nd Steemit Top Ten Tags Weekly Report!
The Steemit Top Ten Tags -- 2nd weekly report shows a new trend which inhibits a very surprising result. For now we will be able to see how does the Steemit Top Ten Tags behave during this new set of data and to be compared from the previous weeks.
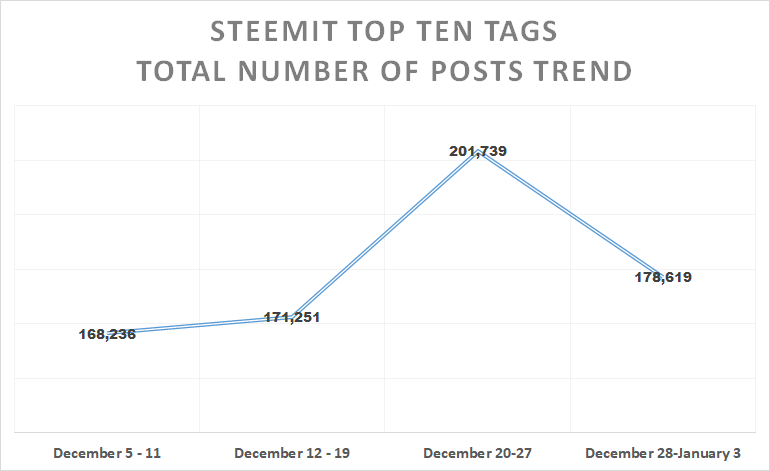
The trend shows an increasing amount in total number of posts during December 5-11 up to December 20-27 and a sudden drop in December 28 - January 3, a sudden drop which accounts to a total of "178,619 POSTS!"
With this analysis, I am gathering the data of Steemit Top Ten Tags (December 28 - January 3, 2018) and be able to compare with the previous week sets of data (December 20-27, 2017). With that, we will be able to witness on how the Steemit Top Ten Tags behave and possibly make some predictions with the use of our gathered data.
Details of the Analysis
- Data were extracted using @arcange's Steem SQL at January 15, 2018 at 8:35PM(UTC+8)
- The analysis features the total number of posts, votes, and comments (December 28 - January 3, 2018) out from the Steemit Top Ten Tags and make some analysis comparing the results from previous week (December 20-27, 2017)
- We will also be able to compute and tabulate the %increase/decrease it made and to determine the behavior of Steemit Top Ten Tags within the specified week
- Table, Bar and Pie Graph Presentations are included for a better understanding of the analysis
- The Steemit Top Ten Tags are the main focus of this analysis ( #life, #photography, #steemit, #bitcoin, #art, #kr, #introduceyourself, #blog, #travel, #steem )
Here's the Data Gathered from December 20-27, 2017
| Tags | Posts | Votes | Comments |
|---|---|---|---|
| life | 56,695 | 742,288 | 192,987 |
| photography | 37,445 | 560,385 | 143,949 |
| steemit | 20,870 | 383,157 | 110,977 |
| bitcoin | 19,832 | 269,145 | 63,302 |
| art | 16,181 | 232,439 | 60,485 |
| kr | 6,078 | 91,023 | 65,433 |
| introduceyourself | 5,299 | 71,692 | 40,508 |
| blog | 19,931 | 371,096 | 93,911 |
| travel | 11,249 | 193,983 | 50,637 |
| steem | 8,159 | 164,136 | 49,942 |
Here's the Data Gathered from December 28, 2017 - January 3, 2018
| Tags | Posts | Votes | Comments |
|---|---|---|---|
| life | 46,945 | 750,235 | 186,855 |
| photography | 35,049 | 551,391 | 143,263 |
| steemit | 20,932 | 405,958 | 115,898 |
| bitcoin | 13,673 | 209,374 | 54,832 |
| art | 14,210 | 218,612 | 59,204 |
| kr | 6,230 | 92,533 | 68,251 |
| introduceyourself | 4,832 | 68,263 | 36,223 |
| blog | 17,790 | 357,124 | 90,322 |
| travel | 10,762 | 202,623 | 53,453 |
| steem | 8,196 | 179,508 | 52,402 |
The trend shows that there's a significant decrease in the Total number of Posts, Votes, and Comments. As a result, the data above shows that the ranking of Steemit Top Ten Tags has changed, the #bitcoin and #art changed rank position where #art is now in 5th position

Rank of Tags during December 12-19, 20107 (Red Box)
Rank of Tags during December 20-27, 2017 (Blue Box)
Rank of Tags during December 28, 2017 - January 3, 2018 (Yellow Box)
Weekly Total Number of Posts
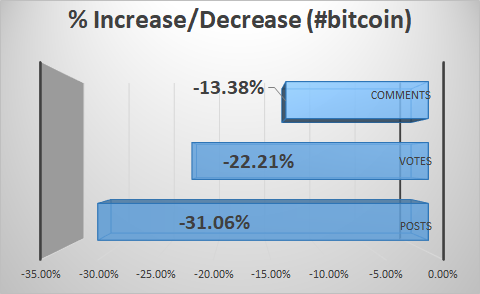
Looking at the consolidated data of weekly posts gathered from the top ten tags, the tag #kr has the highest % increase garnering 2.50% while the tag #bitcoin has the highest % decrease having a -31.06%. Because of the decrease in total number of posts under the #bitcoin tag, it step back to 6th rank.
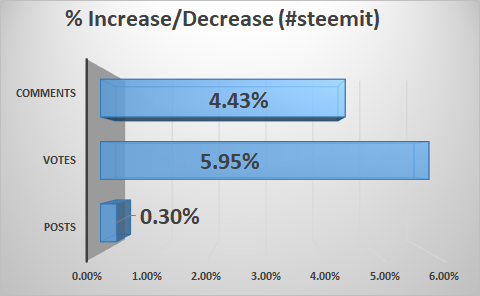
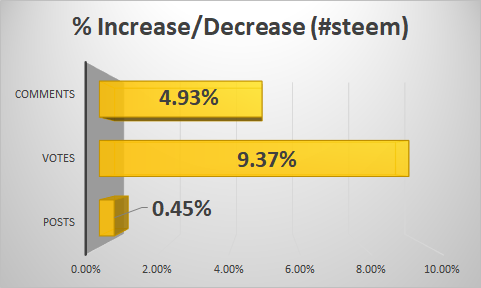
On the other side, the tag #steemit and #steem shows a close amount in % increase of 0.30% and 0.45% which is still a positive % increase amount compared to its previous week.

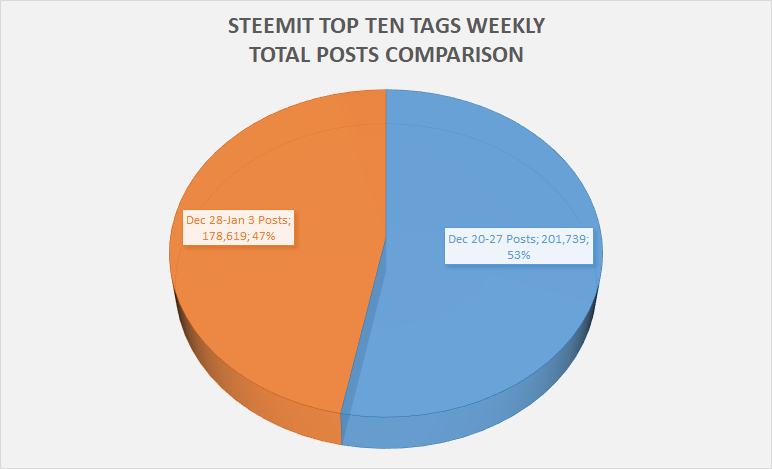
The data above shows a decrease in total number of posts than its previous week resulting a value of -11.46%
Weekly Total Number of Votes


In the weekly total number of votes, the #steem and #steemit tags shows the highest % increase which exhibits an outstanding value of 9.37% and 5.95%.
While the #bitcoin tag still exhibit the lowest % increase, resulting to a negative value of -22.21%. With the data above the total number of votes decreases up to -1.42%
Weekly Total Number of Comments


In the weekly total number of comments, the #travel, #steem, and #steemit tags has the highest % increase which shows a value of 5.56%, 4.93%, and 4.43%
While the #bitcoin and #introduceyourself tag exhibit the lowest % increase, resulting to a negative value of -13.38%, and -10.58%. With the data above the total number of comments decreases up to -1.31%
Data Comparison
So to further analyze the gathered data, We must compare it to the set of datas from the previous week(December 20-27, 2017) and determine the %increase/decrease in number of posts, votes, and comments under the Steemit Top Ten Tags
To analyze the changes I used this method:
"(Dec 28-Jan 3 - Dec 20-27) / Dec 20-27"
With this method I can easily identify the %increase/decrease in total number of posts, votes, and comments under the Steemit Top Ten Tags
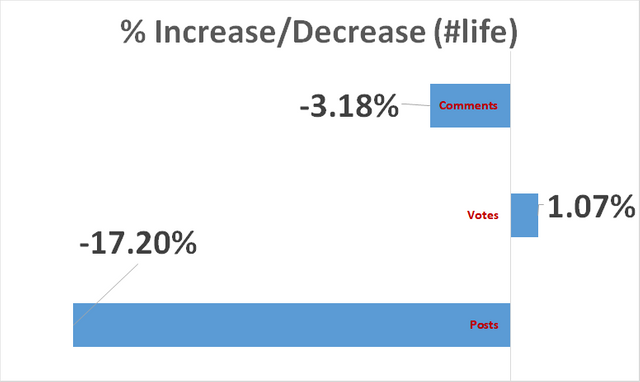
In the first rank #life tag shows a positive % increase of 1.07% only in total number of votes than its previous week
The #bitcoin tag shows a huge % decrease in all aspects(Posts, Votes, and Comments) whereas the #steemit tag performs well with all positive %increase
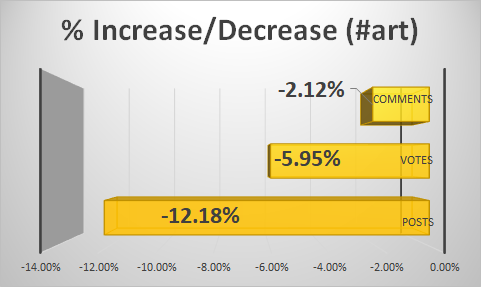
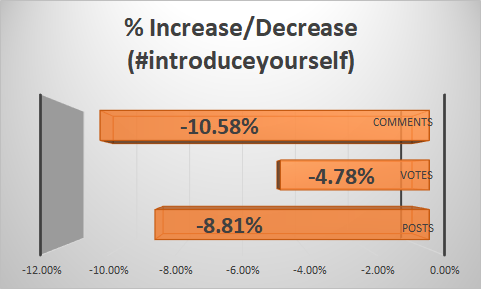
In #art and #introduceyourself tag both exhibits negative %decrease in total number of posts, votes and comments which means a complete decrease in all activities under these tags
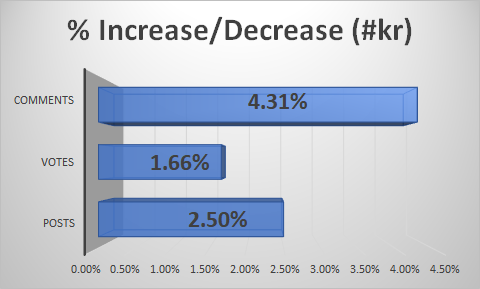
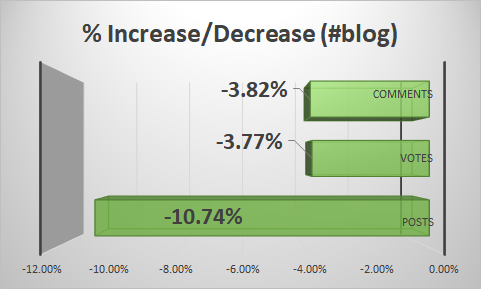
The #kr tag performs really well which results to all positive % increase in total number of posts, votes, and comments. While the tag #blog has a decreasing amount of activities which results to a negative % increase
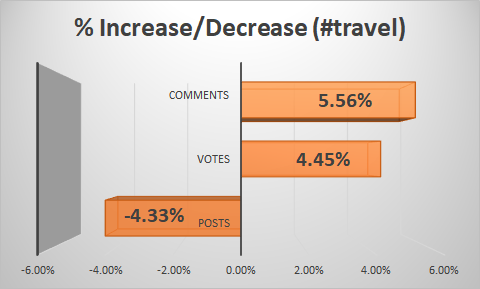
For the last two sets of tags, #steem outperforms #travel in terms of total number of posts, and votes having a higher % increase value, and good thing is that it is also higher output that the previous week except for the total number of posts under the #travel tag wherein it has a negative value of -4.33%
Data Implications
On these weeks of December 28, 2017 - January 3, 2018 the majority of Steemit Top Ten Tags shows an amount of %decrease than the previous week which means the activity of steemians also decreases. Only 4 tags performs a positive %increase in total number of posts, votes, and comments and these are #steemit, #kr, #steem, and #travel (though it has a -4.33% decrease).
Conclusion

During the scope of black circle which ranges from December 22, 2017 up to January 1, 2018 shows a low price closer to 2USD/STEEM
With this dip of STEEM which result to a low price of not less than 2USD/STEEM I noticed that the dates of our December 28 - January 2, 2018 shows a decrease in total number of posts, votes, and comments. Which means that during the sudden drop of STEEM there's also a drop or a minimal activities in some other tags in terms of posting, upvoting and engaging other steemians. And Based on our last analysis the steem chart on that time shows a higher value of steem and with that high value of steem the total number of posts, votes, and comments are also higher and all tags shows positive % increase.
My Thoughts and Vision
I can see that majority of Steemians are driven with the price feed of STEEM and also with SBD, from my previous analysis we already identify and prove that during the sudden "PUMP of SBD" the activities of steemians increases. But in this case wherein the value of STEEM is smaller than the recent price, the activites of steemians decreases which reflects to a % decrease of total number of posts, votes, and comments.
But then I am still counting for another mark price for STEEM and SBD since SMT hasn't launched yet, There might be even more surprising waiting for the future of STEEM and SBD.
Thats all for now. You can also check the previous Weekly analysis prior to this contribution
Posted on Utopian.io - Rewarding Open Source Contributors
Thank you for the contribution. It has been approved.
Dear @dwaeji-aizelle, I'm approving this contribution now because you already show some metrics across multiple weeks. But for future weekly reports please include the data from several previous weeks for all metrics. Comparing one week with another does not make much sense without a longer trend.
You can contact us on Discord.
[utopian-moderator]
Thank you very much @crokkon in fact I am very overwhelmed right now. In my next analysis I will surely include previous sets of data for a better visualization on how the Steemit Top Ten Tags behave.
Hey @crokkon, I just gave you a tip for your hard work on moderation. Upvote this comment to support the utopian moderators and increase your future rewards!
I'll take this as my qoute for today Sir @sorenkierkegaard
very informative post sir
Thank you @kimp0gi
interesting analysis @dwaeji-aizelle :)
Thank you @rejzons 🤗. Stay tune for more weekly report of Steemit Top Ten Tags
Hey @dwaeji-aizelle I am @utopian-io. I have just upvoted you!
Achievements
Community-Driven Witness!
I am the first and only Steem Community-Driven Witness. Participate on Discord. Lets GROW TOGETHER!
Up-vote this comment to grow my power and help Open Source contributions like this one. Want to chat? Join me on Discord https://discord.gg/Pc8HG9x
You have this talent for outstanding analysis. Keep it up. You'll reach more. This analysis has been very detailed. Congratulations @dwaeji-aizelle
Thanks for the appreciation @japh. Stay tune for more weekly Steemit Top Ten tags, I will showcasing the behavior of the tags