IOT project — monitor several sensor data through a dynamic chart and Web UI
New Features
What feature(s) did you add?
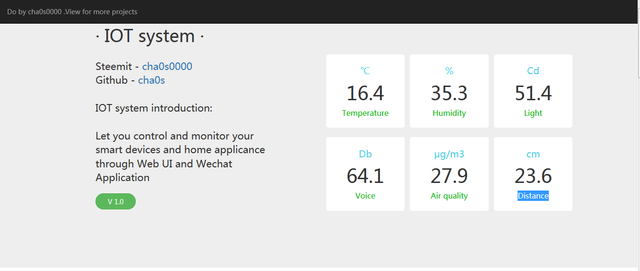
Show six different sensors data in the Web
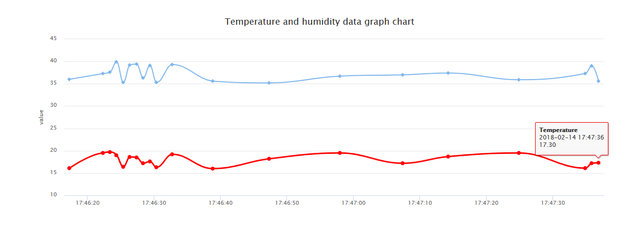
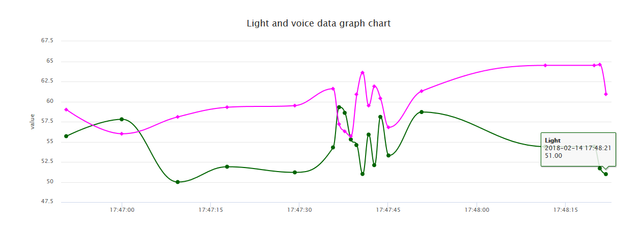
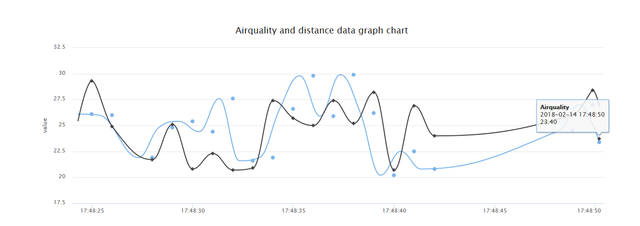
Use graph charts to show the real time data and the movements of data
Temperature and humidity data chart
Light and voice data chart
Airquality and distance data chart
Dynamic charts
Notice
Now although all the data can be shown in Web and shown as the dynamic charts ,the data is made by the random function.So the next step is to get the hardware sensor data and upload to the server and then show them like the way above.


How did you implement it/them?
- Briefly introduce
-
Import the sensor data to showInfoIndex.php and then shown as dynamic chart.In this file ,the sensor data is made by random function,which will be replaced by the data uploaded through ESP8266 firmware in the next version
-
Get the sensor data and show them
- Show some of the new code
- Set up the Web UI
<div class="col-md-6 col-md-offset-1 text-center mt-100 mb-100">

<div class="counter col_third">
<p class="count-unit"> ℃ </p>
<h2 class="timer count-title" id="count-number_temp" data-to="NaN" data-speed="1500" data-decimals="1"></h2>
<p class="count-text"> Temperature </font></p>
</div>

<div class="counter col_third">
<p class="count-unit"> % </p>
<h2 class="timer count-title" id="count-number_humi" data-to="NaN"  data-speed="1500"></h2>
<p class="count-text"> Humidity </p>
</div>

<div class="counter col_third">
<p class="count-unit"> Cd </p>
<h2 class="timer count-title" id="count-number_light" data-to="NaN"  data-speed="1500" data-decimals="1"></h2>
<p class="count-text "> Light </p>
</div>

<div class="counter col_third">
<p class="count-unit"> Db </p>
<h2 class="timer count-title" id="count-number_voice" data-to="NaN"  data-speed="1500" data-decimals="1"></h2>
<p class="count-text "> Voice </p>
</div>

<div class="counter col_third">
<p class="count-unit"> μg/m3 </p>
<h2 class="timer count-title" id="count-number_airQuality" data-to="NaN"  data-speed="1500" data-decimals="1"></h2>
<p class="count-text "> Air quality </p>
</div>

<div class="counter col_third end">
<p class="count-unit"> cm </p>
<h2 class="timer count-title" id="count-number_distance" data-to="NaN"  data-speed="1500"></h2>
<p class="count-text "> Distance </p>
</div>

</div>
According to the number of the sensor data ,I write six
to show all the data.- Get element of the HTML
var temp = document.getElementById('count-number_temp');
var humi = document.getElementById('count-number_humi');
var light = document.getElementById('count-number_light');
var voice = document.getElementById('count-number_voice');
var airquality = document.getElementById('count-number_airQuality');
var distance = document.getElementById('count-number_distance');
Get the data shown in the HTML by get their HTML elements.After this step ,we can update the data in javascript language.
- Create the chart container
<div class="container">
<div class="row" style="text-align:center;">
(html comment removed:  显示Echarts图表highchart )
<div style="height:410px;min-height:100px;margin:0 auto;" id="sensor1"></div>
</div>

<hr class="colorgraph mt-100 mb-100">

<div class="row" style="text-align:center;">
(html comment removed:  显示Echarts图表highchart )
<div style="height:410px;min-height:100px;margin:0 auto;" id="sensor2"></div>
</div>

<hr class="colorgraph mt-100 mb-100">

<div class="row" style="text-align:center;">
(html comment removed:  显示Echarts图表highchart )
<div style="height:410px;min-height:100px;margin:0 auto;" id="sensor3"></div>
</div>


</div>
There are three charts ,respectively sensor1 chart ,sensor2 chart and sensor3 chart.Each chart shows two sensor data in real time.
- Get update data
function update(){
            var xht = new XMLHttpRequest();
            xht.open('GET','sensorsData.php',true);
            xht.onreadystatechange = function () {
                if(xht.status == 200 && xht.readyState ==4){
                    var str = xht.responseText;
                    var json1 = JSON.parse(str);
                    // alert(json_temp);
                    json_temp = json1['temp'];
                    json_humi = json1['humi'];
                    json_light = json1['light'];
                    json_voice = json1['voice'];
                    json_airquality = json1['airquality'];
                    json_distance = json1['distance'];
                    temp.innerHTML = json_temp;
                    humi.innerHTML = json_humi;
                    light.innerHTML = json_light;
                    voice.innerHTML = json_voice;
                    airquality.innerHTML = json_airquality;
                    distance.innerHTML = json_distance;
               }
            };
            xht.send();
        }
By using XMLHttpRequest , request for getting the latest data every one second
- Add data to the dynamic chart
    $('#sensor1').highcharts({
            chart: {
                type: 'spline',
                animation: Highcharts.svg, // don't animate in old IE
                marginRight: 10,
                events: {
                    load: function () {

                        // set up the updating of the chart each second
                        var series_temp = this.series[0],
                            series_humi = this.series[1],
                            chart = this;
                        setInterval(function () {
                            var x = (new Date()).getTime(), // current time
                                y_temp = json_temp,
                                y_humi = json_humi;
                            // alert(y_temp);
                            series_temp.addPoint([x, y_temp], true, true);
                            series_humi.addPoint([x, y_humi], true, true);
                            activeLastPointToolip(chart);
                            // update();
                        }, 1000);
                    }
                }
            },
            title: {
                text: 'Temperature and humidity data graph chart'
            },
            credits: {
                enabled: false //不显示LOGO
            },
            xAxis: {
                type: 'datetime',
                tickPixelInterval: 150
            },
            yAxis: {
                title: {
                    text: 'value'
                },
                plotLines: [{
                    value: 0,
                    width: 1,
                    color: '#808080'
                }]
            },
            tooltip: {
                formatter: function () {
                    return '<b>' + this.series.name + '</b><br/>' +
                        Highcharts.dateFormat('%Y-%m-%d %H:%M:%S', this.x) + '<br/>' +
                        Highcharts.numberFormat(this.y, 2);
                }
            },
            legend: {
                enabled: false
            },
            exporting: {
                enabled: false
            },
            series: [
            {
                name: 'Temperature',
                data: (function () {
                    // generate an array of random data
                    var data = [],
                        time = (new Date()).getTime(),
                        i;
                    for (i = -19; i <= 0; i += 1) {
                        data.push({
                            x: time + i * 1000,
                            y: Math.random()
                        });
                    }
                    return data;
                }()),
                color:'#ff0100'
            },
             {
                name: 'Humidity',
                data: (function () {
                    // generate an array of random data
                    var data = [],
                        time = (new Date()).getTime(),
                        i;
                    for (i = -19; i <= 0; i += 1) {
                        data.push({
                            x: time + i * 1000,
                            y: Math.random()
                        });
                    }
                    return data;
                }())
            }]
        }, function(c) {
            activeLastPointToolip(c)
        });
After getting the latest data , add data to the charts as well as setting their show style and x ,y axis.
Roadmap
- The function existing
- Now , There are two ways to control the IOT smart hardware remotely.
- Now,we can monitor several sensor data in the dynamic chart and Web UI.
- In the future ,the IOT system will become more powerful
- Write ESP8266 firmware to get sensor data and upload to the server
- Add a login system to become more practical
- Focusing more on UI design
- Connect to the Home appliance with using relay module
- Add more control and monitor way like discord controlling and so on.
How to contribute?
Github: https://github.com/Cha0s0000/IOT
- Fork it!
- Create your feature branch:
git checkout -b my-new-feature - Commit your changes:
git commit -am 'Add some feature' - Push to the branch:
git push origin my-new-feature - Submit a pull request.
Posted on Utopian.io - Rewarding Open Source Contributors
Thank you for the contribution. It has been approved.
You can contact us on Discord.
[utopian-moderator]
Thanks for your work .happy new year
Hey @cha0s0000 I am @utopian-io. I have just upvoted you!
Achievements
Community-Driven Witness!
I am the first and only Steem Community-Driven Witness. Participate on Discord. Lets GROW TOGETHER!
Up-vote this comment to grow my power and help Open Source contributions like this one. Want to chat? Join me on Discord https://discord.gg/Pc8HG9x
test bot