Turkish Community on Steemit in 2017
Details
The goal of this analysis is to show the activity of Turkish users on Steemit on 2017. The analysis is intended to see the annual progress made under the tr tag.
Those analyses are based from "tags", "authors" and "payouts" for each individual posts.
Outline
- Scope of Analysis
- Tools and Code
- Results
- Summary
1 - Scope of Analysis
Date of the analysis is 09.02.2018 and timeframe of the analyzed data is between from 01.01.2017 to 01.01.2018.
2 - Tools and Code
The data to be analyzed is taken from SteemSQL - A publicly available SQL database – by using DBeaver. And charts and graphics are produced by using MS Excel.
I used the following code to get the information which X, Y, Z are the parameters I looked into and A, B are the numbers of the date range:
Select X, Y, Z
FROM comments (NOLOCK)
 where
 created >= ('2017-0A-01T00:00:00.000Z')
 AND created < ('2017-0B-01T00:00:00.000Z')
 and Depth = 0
 And json_metadata like '%"tr"%'
3 - Results
In 2017, 1630 authors have created 19842 posts with tr tag and 99938 comments have been made under those posts.
I have analyzed the distribution of posts & comments in all posts that authors created in 2017. In 2017, we have averagely 1580.3 number of posts for each month, and 8404.916 comments have been done per month. I have tabulate the overall distribution of posts & comments for months. Results are given below:
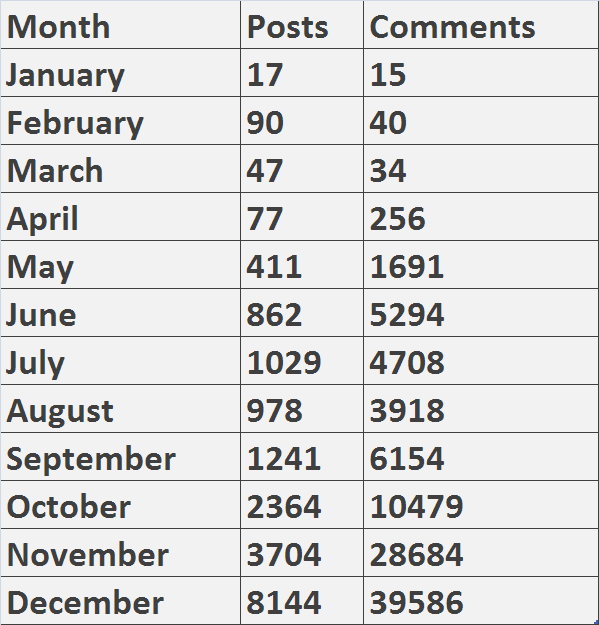
From the table, we can do the following conclusion for the posts:
- Number of posts are monotonically increasing expect for the period July-August and February- March
- Maximum number of increase has happened the November- December period.
- Maximum number of increase with respect to ratios has happened on the April–May period. (multiplier ratio is 5.337)
From the table, we can do the following conclusion for the comments:
- Number of comments are generally monotonically increasing expect for the period February–March , June–July and July-August.
- Maximum number of increase has happened the October-November period.
- Maximum number of increase with respect to ratios has happened on the March–April period. (multiplier ratio is 7.53)
As a next step, I have analyzed the number of unique authors per month. Results are given below:
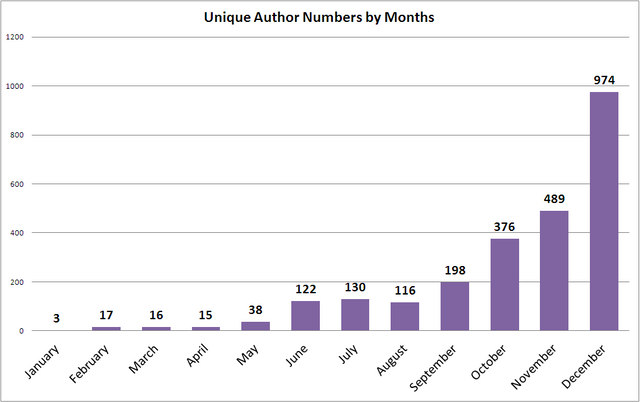
From the graph, we can say that after September, number of unique authors have been increased dramatically. For overall distribution, we have monotonically increase expect February-April and July-August period. Number of unique author per month is 207.83.
When we look out the payout distribution by month, we have a different distribution which we can see from the graph that is given below:
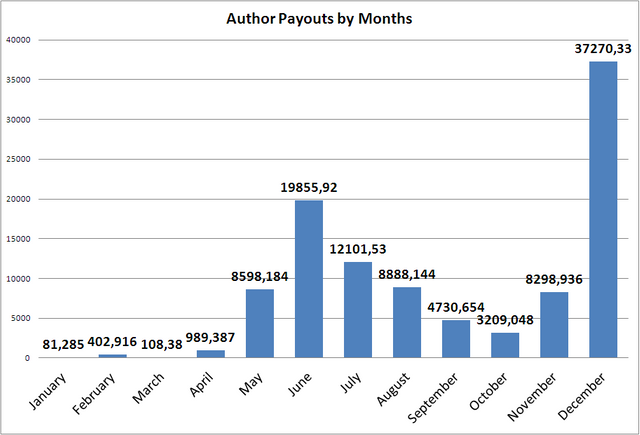
From the graph we can say that:
- Average author payout per month is 8711,227
- Maximum payout for unique authors is maximum at June.
- Payouts at June and December are higher than the other months
As an another distribution, I have focused on number of posts and authors payout relation, I have found this result:
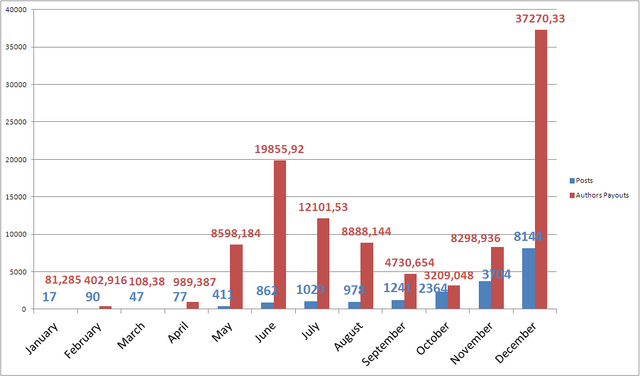
In this graph, we can conclude same results as previous one. June and December are the leaders in terms on authors payouts. On June, we have $23.034(SBD+SP) payout per post in June and the case is $4.576(SBD+SP) in December.
When we look at the payout distribution by posts, we have the following graph:
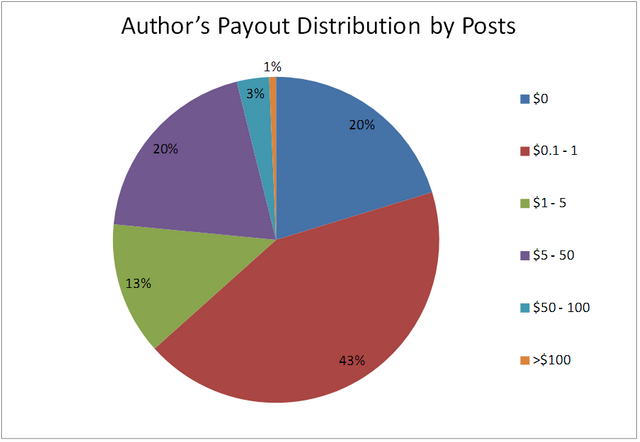
Nearly 50% of the posts have no payouts, or payouts that we can neglect.
Some top 10 situations:
3.1 - Top 10 Authors by Number of Posts
On the table which is given below, shows us top ten authors of the year.
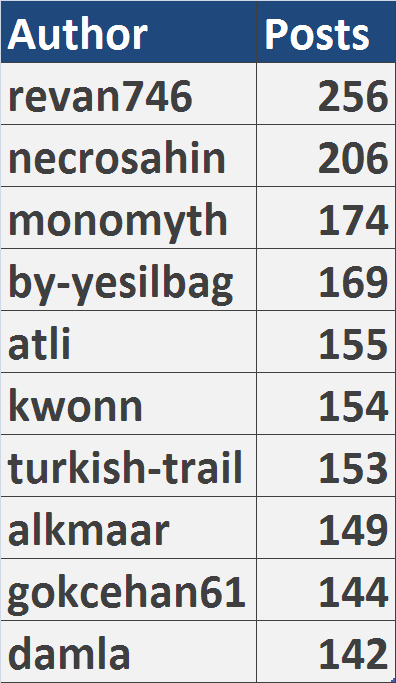
Those authors have 8.5% of total number of posts in January.
3.2 - Top 10 Authors by Posts Payouts
On the table which is given below shows us the top ten authors of the year with respect to payouts.
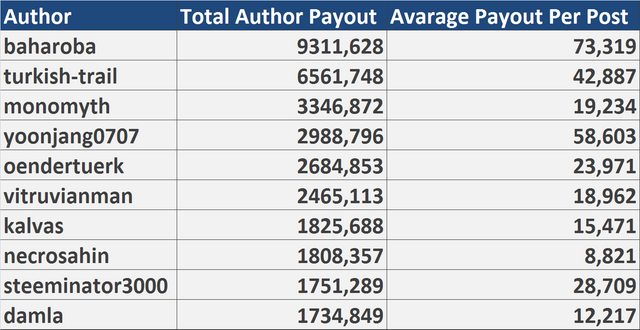
Those authors get 25.3% of total payouts in the tr tag in January.
3.3 - Top 10 Tags by Posts Payouts
On the table which is given below shows us top ten category(first tag of the post) of the year with respect to payouts.
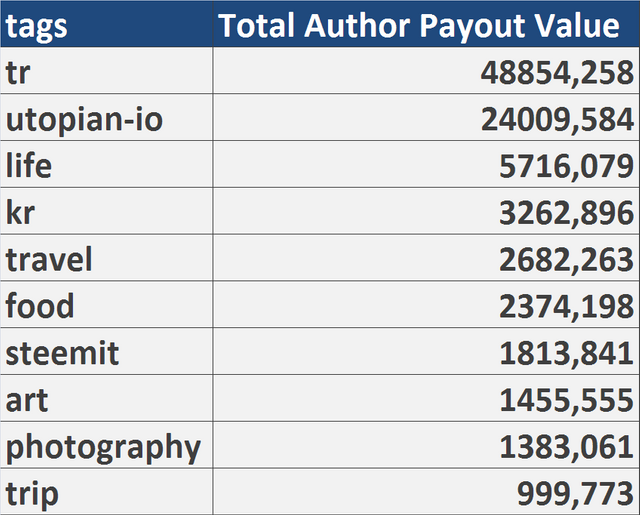
Those tags get 67.8% of total payouts in the tr tag in January.
4 - Summary
Turkish community has become more active on Steemit by each mount; number of unique authors, posts are generally tend to grow. Especially last 3 months of the 2017, the community have obvious increase in terms of numbers.
Before ending my analysis, let me give some numbers about the community:
- Total number of posts under the
trtag: 19842 - Total number of the comments on the posts with the
trtag: 99938 - Total number of the unique user who posted under
trtag: 1631 - Total amount of payment under the
trtag: $136367,15 (Total author payment is 105399,3 and total curator payout is 30967,85)
Posted on Utopian.io - Rewarding Open Source Contributors
Thank you for the contribution. It has been approved.
You can contact us on Discord.
[utopian-moderator]
Coins mentioned in post:
For more Analysis to @a-blockchain
Hey @alfanerd I am @utopian-io. I have just upvoted you!
Achievements
Community-Driven Witness!
I am the first and only Steem Community-Driven Witness. Participate on Discord. Lets GROW TOGETHER!
Up-vote this comment to grow my power and help Open Source contributions like this one. Want to chat? Join me on Discord https://discord.gg/Pc8HG9x