Fibonacci Tools - Crypto Academy / S6W4 - Homework post for professor @pelon53
Hello, Steemians. I am happy to come back to the academy to learn from respected professor @pelon53 through his teaching on Fibonacci tools, this is going to be a wonderful opportunity for me to add more knowledge to myself in technical analysis. The professor gave a homework task at the end of the lecture and I will be writing on the questions.
Question 1
Explain in your own words what you mean by Fibonacci retracement. Show an example with screenshot
Fibonacci Retracement
Fibonacci retracement is a wonderful technical analysis tool that was believed to have been used earlier before it was modified or introduced to western countries. It works on the mathematical concept of sequence of numbers, which certified that the addition of the current and the previous numbers produce the next number in the sequence. An example of this is 1,3,5,8,13,21,34, 55... Nth, watching the series closely, the current number and the previous one produce the next one.
The division of a number by the previous number as the sequence progresses, gives the result around 1.618 and this is regarded as the golden ratio, an example is that of my sequence in the last paragraph, the last number divided by the previous number, 55/34 whose result is 1.618.
Fibonacci retracement can also be defined as a Fibonacci sequence that shows the resistance and support levels on the chart of a cryptocurrency. These levels in a prevailing trend are where the price of the asset is likely to retrace, retracement trend before the market continues in the direction of the prevailing trend and this is impulse trend. The Fibonacci retracement lines are horizontal which track pullbacks and continuation in the prevailing trend.
The Fibonacci retracement levels are represented in percentages, from 23.6%, 38.2%, 50%, and 61.8%, 78.6%. The percentage levels 23.6%, 38.2%, and 61.8% are the key levels that show how the prevailing trend has moved before the price retraces and later moved in the direction of the trend again. Furthermore, the 50% level is generally a correction zone where price has held up after retracement to continue the prevailing trend. The 78.6% level is the first swing of the Fibonacci retracement tool where the price retraced.
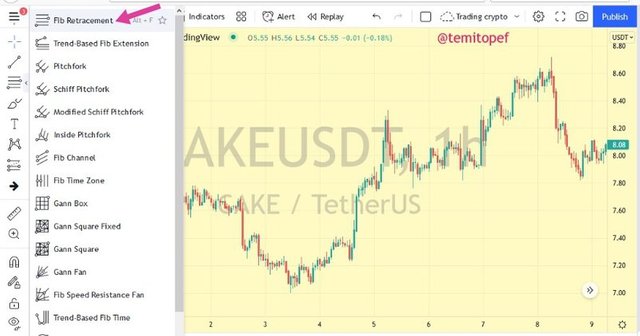
For me to be able to use the Fibonacci retracement on the cryptocurrency chart, I will be adding it as it is in the analysis image below.
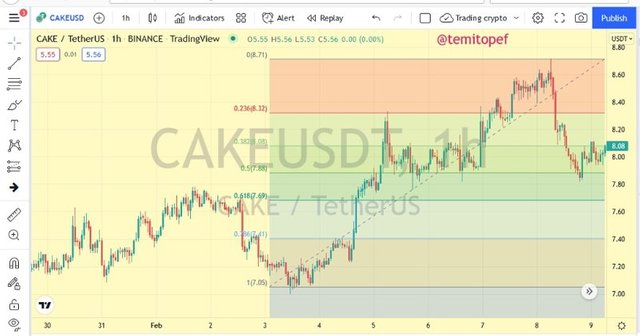
In my practical analysis image above, there are some things to take note of, starting point 0 and the endpoint 1. In a bullish trend, the market of CAKE retraced at 78.6% (R5), retraced at 61.8% (R4), retraced at 38.2% (R2), and retraced at 23.6% (R1). The market of CAKE cryptocurrency was bullish and the 50% level as I have explained before, the level act as the correction zone as the prevailing bullish trend continued.
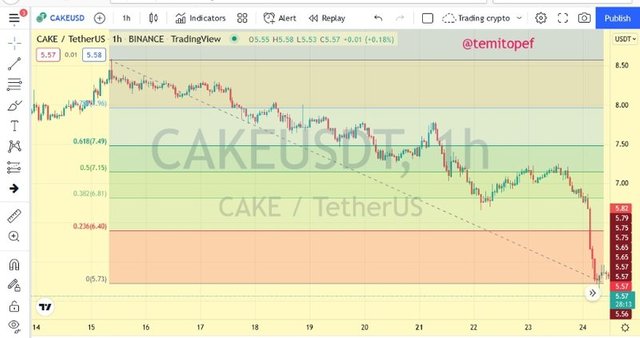
In my practical analysis image above, the price of CAKE cryptocurrency retraced at 78.6% before breaking through, retraced at 61.8%, and retraced at 38.2%, a correction of the trend occurred at 50% zone as high volatility pushed the market below 23.6%. This also shows how the Fibonacci retracement tool works on the cryptocurrency chart acting as support and resistance levels.
Furthermore, in a bullish cryptocurrency market,. mostly the % retrace levels act as resistance zones while the % retrace 3 (50%) act as a support level for continued bullish phase of the market. In a bearish cryptocurrency market, mostly the % retrace levels act as support zones while the % retrace 3 (50%) act as resistance for continued bearish phase. The retrace levels can sometimes also act as support levels after retracement in a bullish trend and as resistance levels after retracement in a bearish trend.
Question 2
Explain in your own words what you mean by Fibonacci extension. Show an example with screenshot
Fibonacci Extension
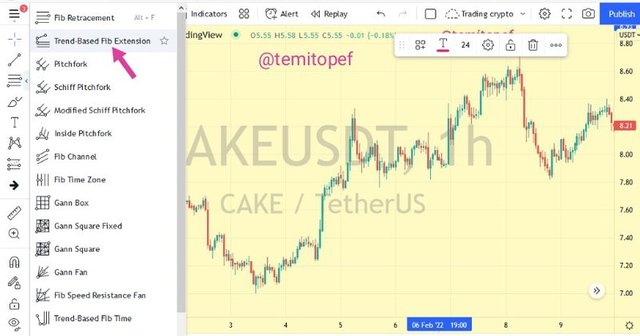
Fibonacci extension is simply the extension of the Fibonacci retracement tool that is used to confirm how far a prevailing trend can go after it has been retraced from any of the retrace levels. This tool is used by the analysts on the cryptocurrency chart to project their trade profit levels by determining how far the market can go. The importance of this tool is that after the pullback has occurred, the Fibonacci extension tool is used to determine how far the next swing would go in a cryptocurrency market.
Furthermore, three points are needed on the cryptocurrency chart to be drawn from the beginning of the prevailing trend. The first point to be identified is where the trend begins, I can call this the point zero (0), the next point is the level where there was retracement, a pullback of price, point A and the last point of these three points to be located in the level where the retracement trend ended, I can say this point is B. The Fibonacci extension tool is used to project how far the impulse trend from B can go, to project profits by the analyst.
Furthermore, the Fibonacci extension tool assumes that the impulse trend will tend towards the golden ratio, 1.618. I will be adding the tool to the cryptocurrency chart to see how it works.
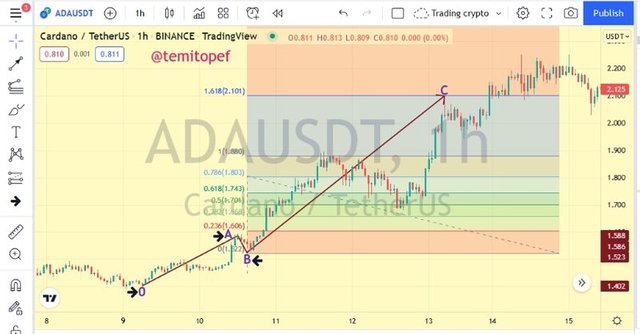
In my practical analysis image above, I have located the beginning of the bullish trend that I labeled as point 0, the first retracement occurred at 23.6%, point A which caused a pullback of the price of ADA (Cardano). The retracement trend ended at point B and the impulse trend began at that point as the price of ADA hits the golden ratio level, 1.618 at point C, this is how the Fibonacci extension tool is used for determining how far the price can go after a retrace and to project profit leveQuestion 3
Perform the calculation of the Fibonacci retracement, for the levels of: 0.618 and 0.236. Pick a crypto pair of your choice. Show a screenshot and explain the calculation you made
First, we have 5 retrace levels of the Fibonacci retracement tool; R1 = 0.236, R2 = 0.382, R3 = 0.5, R4, = 0.618, and R5 = 0.786. The question in this section of the task asks for the calculation of the retracement levels 0.618 and 0.236, that is R4 and R1.
Calculation of Fibonacci retracement levels
The ADA cryptocurrency chart will be used to perform this analysis. The levels R4 and R1 will be calculated respectively. The formula for calculating it is R(n) = X + [(1 - %Retrace(n)/100) * (Y-X)].
X = The initial price of the cryptocurrency where the Fibonacci retracement tool begins.
Y = The maximum price of the cryptocurrency where the Fibonacci retracement tool ends.
The levels are:
% Retrace 1 = 23.6%
% Retrace 2 = 38.2%
% Retrace 3 = 50%
% Retrace 4 = 61.8%
% Retrace 5 = 78.6%
Calculating level 0.618 (R4) for ADA/USDT
R4 = X + [1 - %Retrace4/100) * (Y-X)
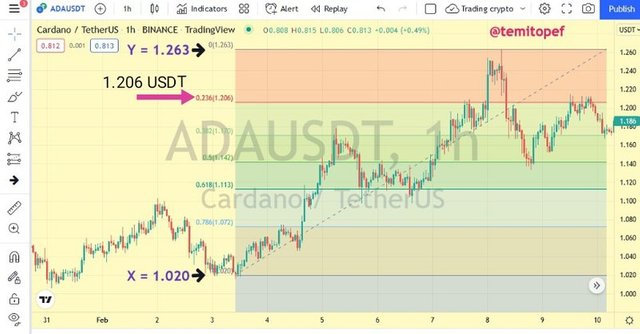
X = 1.020 and Y = 1.263
R4 = 1.020 + [(1-0.618) * (1.263 - 1.020)
R4 = 1.020 + (0.382 * 0.243)
R4 = 1.020 + 0.092826
R4 = 1.1128, approximately 1.113 USDT.
My calculation and the analysis on the cryptocurrency chart are the same and I will show it below.
ls.
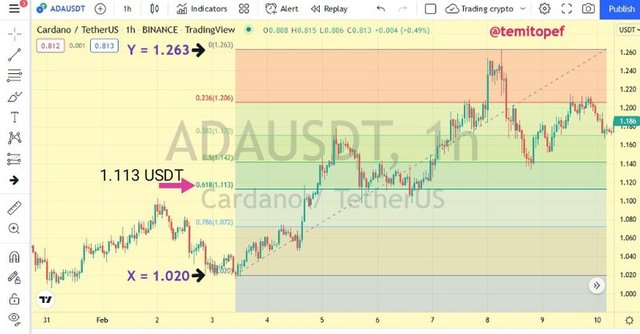
Calculating level 0.236(R1) for ADA/USDT
R1 = X + [1 - %Retrace1/100) * (Y-X)
X = 1.020 and Y = 1.263
R4 = 1.020 + [(1-0.236) * (1.263 - 1.020)
R4 = 1.020 + (0.764 * 0.243)
R4 = 1.020 + 0.185652
R4 = 1.2056, approximately 1.206 USDT.
For this also, my calculation and the analysis on the cryptocurrency chart are the same and I will show it below.