⚡Supply and Demand Indicator ⚡ Best Price Action Indicator ⚡
Stop Risking Money with Conventional Indicators!!
Discover Hidden Opportunities with Supply & Demand Indicator
Why You Should Trade with Supply & Demand Indicator?
The Most Successful Traders Use This
➡️ Identify HIGH Probability Supply & Demand Zones
➡️ Subjective Analysis Based on Higher Timeframe
➡️ Pinpoint entries, High-risk reward & Low drawdown trade setups!
➡️ Timely Alert System for potential Trade Opportunity
Unlock the Full Power of Indicator!
It’s important to get your trading career off on the right foot!
We Managed to Overcome One of the Biggest Challenges Faced by Traders
Trade with confidence
Most traders use simple mathematical formula-based indicators in their trading. And they all end up losing money. Why? Because formula-based indicators always lag behind the price. You can use RSI, MACD, Stochastic… etc., to try to catch up to the price, but that still won’t get you anywhere because those indicators lag behind the price and will always be late to give you a signal.
Why do people fail in trading by using lagging indicators?
❌ There are many technical indicators on the internet, but it is important to know that most of them are misleading
❌ Traditional indicators lag behind the price and often give false signals.
❌ If you’re a busy person, you probably won’t have enough time to look over the market for high probability opportunities
Trust us; We know because we wasted a lot of time and money using them before finally figuring it out.
Check out the image below to get a better picture of the situation.

That’s why we have created our own indicator— “The Supply & Demand Indicator”! It’s not based on formulas or math tricks; it works based on the laws of nature. Every single thing in nature follows the core concepts of Supply & Demand.
Get Started Now!
Would you like to be on the winning side? If so, hold on! Don’t rush in yet!
Stop risking money with conventional indicators!
Our indicator tracks the Price Action to generate a signal. In comparison, conventional indicators will generate a signal whenever it meets a specific mathematical condition, without regard for whether demand is greater or supply is greater.
Let’s take a look at the candlestick chart below.
As an example, the Relative Strength Index (RSI) will generate a BUY signal when the RSI value is below 30, indicating oversold conditions. However, in actuality, a buy signal should be generated at the demand zone because price will remain oversold until demand increases. This will lead to poor risk management resulting in increasing odds of loss.
Conventional Indicator
Supply & Demand indicator
supply demand signals
The market is purely Natural you can survive by following natural patterns of the market. And the Supply & Demand indicator can help you do that!
Let’s explore the ways in which trading depends on supply and demand…
What is the origin of this supply & demand indicator?
Our Supply and Demand Indicator is made by using the four essential laws of supply and demand in trading.
Since ancient times, the concepts of Supply and Demand have been a part of human life. These two principles govern all living things.
It is a simple rule that explains how any product’s value and market price are determined.
Supply refers to the amount of a product available on the market. On the other hand, demand is the number of customers wanting to buy that product. If supply is high and demand is low, prices will go down. On the other hand, if supply is low, but demand is high, prices will increase.

Supply & Demand Trading in Technical Analysis
Now You know that supply and demand are two basic laws of nature, but you cannot apply them directly to forecast the market using technical analysis.
So we have further categorized these laws into two natural processes.
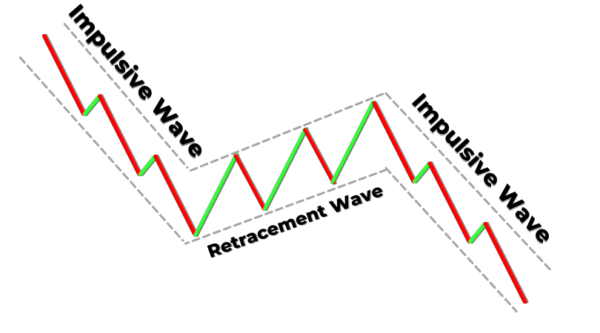
Impulsive wave
Retracement wave

Every market move is based on these two waves. After the impulsive wave, a retracement wave will form. After the retracement wave, an impulsive wave will form. And this process will continue forever.
So we have used this natural process in terms of supply and demand in a technical way.
For example, Rally base rally indicates an increase in demand in the market. But in technical analysis, an impulsive wave represents a rally, a retracement wave represents the base, and again an impulsive wave represents rally.
The following formula will form.
Impulsive wave + Retracement wave + Impulsive wave
So, when this pattern forms on the chart, it means demand has been increased in the market and price will go up.
BUY NOW:-https://bit.ly/3D5aGXT
Bullish Wave

Bearish Wave
It was difficult for retail traders to recognize accurate supply and demand areas because it is not easy to detect waves correctly all the time. So, we further did a higher timeframe analysis and made it easy to find supply and demand zones on the chart.
Continue Reading…
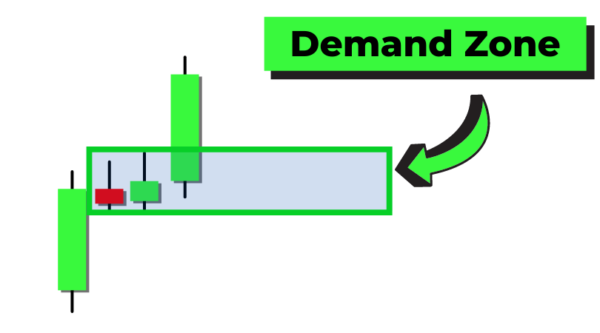
If you analyze an impulsive wave on a higher timeframe, you will see a big candlestick with a bigger body as compared to the last 10 to 20 candlesticks. In short, the body to wick ratio of the candlestick will be greater than 70%.
Simply
➡️ Impulsive wave = Big body candlestick
On the other hand, if you analyze the retracement wave on a higher timeframe, you will see a base candlestick with a small body and large shadows. It will relate to the doji candle. In short, the body to wick ratio of the base candlestick will be less than 20%.
Simply
➡️ Retracement wave = Base candlestick
So, a complex formula has been turned into three simple candlesticks
Big candlestick + Base Candle + Big candlestick
We have used these candlesticks to make a professional supply and demand indicator. It is the simplest way to understand the origin of this indicator. You will get much more in the indicator, PDF ebook, and video bundle.
BUY NOW:-https://bit.ly/3D5aGXT

The Settings of the S&D Indicator are fully Customizable.
Let us show you:
The Candle Body Percentages:
You can specify the candle body percentages of Rally, Drop and Base Zone candles. This allows you to look for all possible supply and demand zones. After applying the indicator on the chart and specifying the candle body sizes, the indicator will start drawing supply and demand zones under specified conditions in real-time.
Custom Colors:
You can change the colours of zones table cells anytime in the settings at your own will.
Show/Hide Button:
In the indicator settings, there are options if you want to show or hide some specific zones on the chart. You can also show or hide the table at your own will.
BUY NOW:-https://bit.ly/3D5aGXT

Mobile & Desktop Friendly
Our supply and demand indicator is responsive and looks great on any device
BUY NOW:-https://bit.ly/3D5aGXT

Real-time Alerts
The indicator has a feature where you can set up alerts for any charts, and whenever the indicator detects a supply or demand zone, it will send you a real-time alert. This feature will help you stay on top of your trading.
8X Your Trading Account Using a Semi-Manual Trading Strategy
Most traders trade without a plan and ignore market risks. So we have created a supply & demand trading strategy that will give you a POWERFUL edge on making great trades.
This is a semi-manual strategy. It means you will use the supply-demand indicator and our PROVEN strategy to make great trades. It doesn’t matter whether you have a small or big trading account. This trading strategy will work for you.
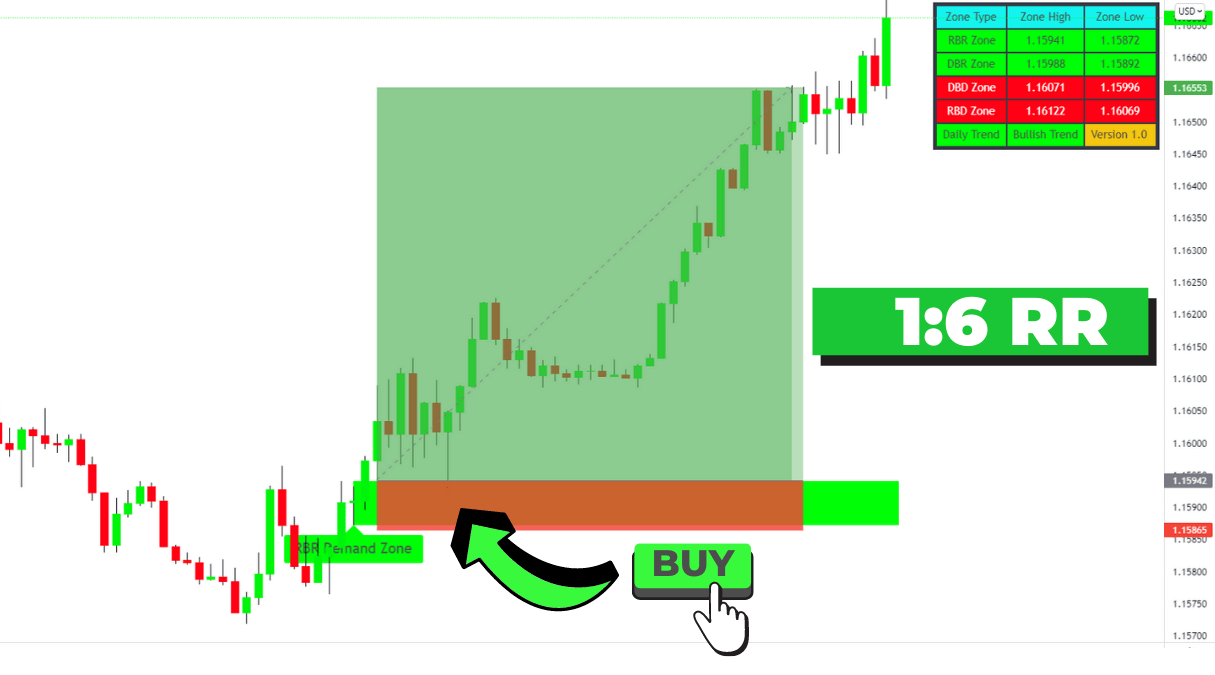
The best thing about the supply and demand indicator is that it helps to pick ULTRA HIGH risk-reward trades. So, we have created a powerful trading strategy by using confluence of other technical tools and risk management. This is the method of institutional traders to make a high probability strategy using a confluence of technical tools.

This strategy helped us make high-risk-reward profitable trades. Like in GBPJPY, we were able to pick a trade with 1:14 risk-reward ratio.
Live Trade Examples


BUY NOW:-https://bit.ly/3D5aGXT