Trading NZD / USD: general analysis buy and sell price gtu
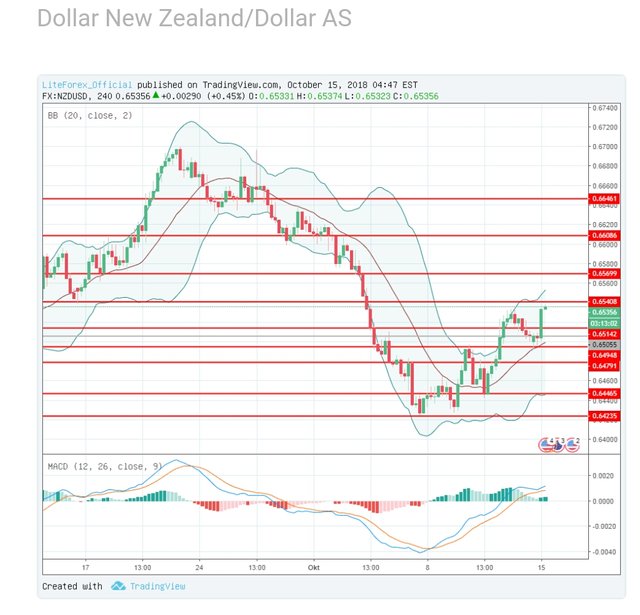
current trends last week, the couple NZD / USD 0.38% higher moderate because the weakening the US dollar after the release of consumer price index as negative. in addition, this instrument supported by a substantial increase in China's trade surplus on Friday. investors are waiting publication data US retail sales, which will be released today at 14:30 (GMT + 2). index is expected to grow to be 0.7% in September of 0.1% a month before. confirmation forecast can support USD. support and resistance on the chart 4 hours, instruments corrected to MA from Bollinger bands, which is the key support. indicator reverse sidelong, and the price range remain unchanged, confirm the dynamics of correction. MACD histogram save signal buy a weak.
Resistance Levels: 0.6514, 0.6540, 0.6570, 0.6608, 0.6646.
Support Levels: 0.6494, 0.6479, 0.6446, 0.6423.
Trading tips
Short positions can be opened below the 0.6490 level with the target at 0.6425 and stop loss 0.6518. Implementation period: 1-2 days.
Long positions can be opened above the level of 0.6520 with the target at 0.6560 and stop loss at 0.6505. Implementation period: 1 day.
Scenario
Daily time period
SELL STOP recommendations
Entry point 0.6485
Take Profit 0.6425
Stop Loss 0.6518
Key levels are 0.6423, 0.6446, 0.6479, 0.6494, 0.6514, 0.6540, 0.6570, 0.6608, 0.6646
Alternative scenario
BUY recommendation
Entry point 0.6522
Take Profit 0.6560
Stop Loss 0.6505
Key levels are 0.6423, 0.6446, 0.6479, 0.6494, 0.6514, 0.6540, 0.6570, 0.6608, 0.6646