Bitcoin price in Log Chart - Do you have Faith?
This is the Bitcoin price monthly chart plotted in the log scale. For people who have faith in cryptocurrency and blockchain, this may just be the beginning of a journey to DA MOON :)
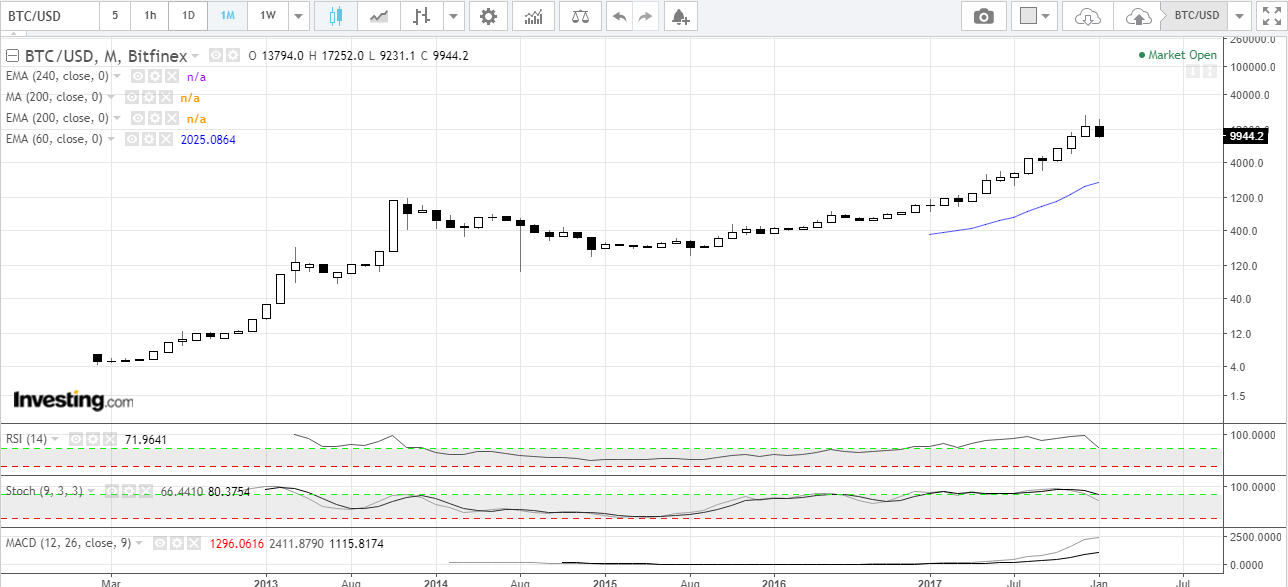
In the near term, though, there may still be violent ups and downs. Looking at the daily chart, I wouldn't be surprised if we see price down to $6,000 or lower. It's usually rather difficult to come in right at the bottom with a large position so that you can really make some money. A much better and proven strategy is to dollar-cost averaging, "where you plunk a set amount into an investment on a fixed schedule, whether the market is up or down." This is very much like making a monthly contribution to your 401k.

Now to invest in 401k is easier to comprehend. The large funds and the general market are consistently trending up nicely if we look at a long enough period of time. In other words, we have faith in the stock market. For dollar-cost averaging to work for Bitcoin, you would need the same faith in that Bitcoin will eventually climb much higher that what's it 's worth today.
Do you have the faith?
I think BTCUSD after some days this price 15000 teach
I believe in the long term it would be worth much more than that. Near term is hard to predict.
I have faith it, or a derivative, will be a usable currency in the near future (<10 years). What it'll be worth by the time I can use it is anyone's guess!
I agree. Just don't invest more than you can risk.