Why Successful Traders Use Fibonacci and the Golden Ratio , Tips for "STEEMERS"

There is a special ratio that can be used to describe the proportions of everything from nature's smallest building blocks, such as atoms, to the most advanced patterns in the universe, such as unimaginably large celestial bodies. Nature relies on this innate proportion to maintain balance, but the financial markets also seem to conform to this 'golden ratio.' Here we take a look at some technical analysis tools that have been developed to take advantage of it.
The Mathematics
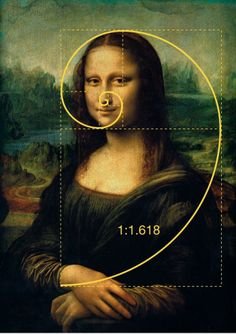
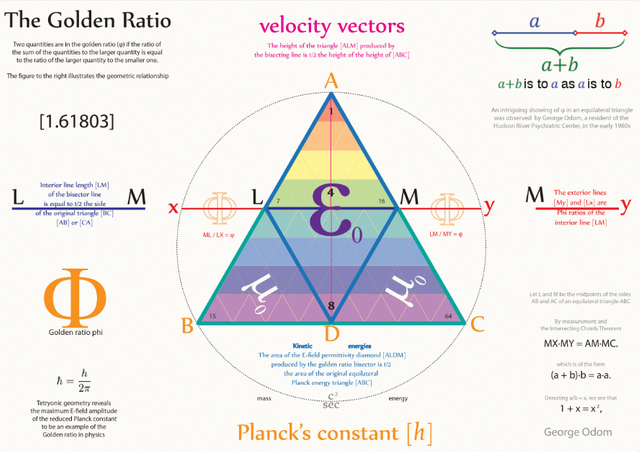
Mathematicians, scientists and naturalists have known this ratio for years. It's derived from something known as the Fibonacci sequence, named after its Italian founder, Leonardo Fibonacci (whose birth is assumed to be around 1175 AD and death around 1250 AD). Each term in this sequence is simply the sum of the two preceding terms (1, 1, 2, 3, 5, 8, 13, etc.).But this sequence is not all that important; rather, it is the quotient of the adjacent terms that possesses an amazing proportion, roughly 1.618, or its inverse 0.618. This proportion is known by many names: the golden ratio, the golden mean, PHI and the divine proportion, among others. So, why is this number so important? Well, almost everything has dimensional properties that adhere to the ratio of 1.618, so it seems to have a fundamental function for the building blocks of nature.Prove It!
Don't believe it? Take honeybees, for example. If you divide the female bees by the male bees in any given hive, you will get 1.618. Sunflowers, which have opposing spirals of seeds, have a 1.618 ratio between the diameters of each rotation. This same ratio can be seen in relationships between different components throughout nature.Still don't believe it? Need something that's easily measured? Try measuring from your shoulder to your fingertips, and then divide this number by the length from your elbow to your fingertips. Or try measuring from your head to your feet, and divide that by the length from your belly button to your feet. Are the results the same? Somewhere in the area of 1.618? The golden ratio is seemingly unavoidable.But that doesn't mean that it works in finance … does it? Actually, the markets have the very same mathematical base as these natural phenomena. Below we will examine some ways in which this ratio can be applied to finance, and we'll show you some charts to prove it!The Fibonacci Studies and Finance
When used in technical analysis, the golden ratio is typically translated into three percentages: – 38.2%, 50% and 61.8%. However, more multiples can be used when needed, such as 23.6%, 161.8%, 423% and so on. There are four primary methods for applying the Fibonacci sequence to finance: retracements, arcs, fans and time zones.
Why Successful Traders Use Fibonacci and the Golden Ratio
Support and resistance levels on bar charts are a major component in the study of technical analysis. Many traders, including myself, use support and resistance levels to identify entry and exit points when trading markets. When determining support and resistance levels on charts, one should not overlook the key Fibonacci percentage “retracement” levels. I will detail specific Fibonacci percentages in this feature, but first I think it’s important to examine how those numbers were derived, and by whom.Leonardo Fibonacci da Pisa was a famous 13th century mathematician. He helped introduce European countries to the decimal system, including the positioning of zero as the first digit in the number scale. Fibonacci also discovered a number sequence called “the Fibonacci sequence.” That sequence is as follows: 1,1,2,3,5,8,13,21,34 and so on to infinity. Adding the two previous numbers in the sequence comes up with the next number.Importantly, after the first several numbers in the Fibonacci sequence, the ratio of any number to the next higher number is approximately .618, and the next lower number is 1.618. These two figures (.618 and 1.618) are known as the Golden Ratio or Golden Mean. Its proportions are pleasing to the human eyes and ears. It appears throughout biology, art, music and architecture. Here are just a few examples of shapes that are based on the Golden Ratio: playing cards, sunflowers, snail shells, the galaxies of outer space, hurricanes and even DNA molecules. William Hoffer, in the Smithsonian Magazine, wrote in 1975: “The continual occurrence of Fibonacci numbers and the Golden Spiral in nature explain precisely why the proportion of .618034 to 1 is so pleasing in art. Man can see the image of life in art that is based on the Golden Mean.”I could provide more details about the Fibonacci sequence and the Golden Ratio and Golden Spiral, but space and time here will not permit. However, I do suggest you read the book “Elliott Wave Principle” by Frost and Prechter, published by John Wiley & Sons. Indeed, much of the basis of the Elliott Wave Principle is based upon Fibonacci numbers and the Golden Ratio.Two Fibonacci technical percentage retracement levels that are most important in market analysis are 38.2% and 62.8%. Most market technicians will track a “retracement” of a price uptrend from its beginning to its most recent peak. Other important retracement prcentages include 75%, 50% and 33%. For example, if a price trend starts at zero, peaks at 100, and then declines to 50, it would be a 50% retracement. The same levels can be applied to a market that is in a downtrend and then experiences an upside “correction.”The element I find most fascinating about Fibonacci numbers, the Golden Ratio and the Elliott Wave principle, as they are applied to technical analysis of markets–and the reason I am sharing this information with you–is that these principles area reflection of human nature and human behavior. The longer I am in this business and the more I study the behavior of markets, the more I realize human behavior patterns and market price movement patterns are deeply intertwined. Prove It!Don't believe it? Take honeybees, for example. If you divide the female bees by the male bees in any given hive, you will get 1.618. Sunflowers, which have opposing spirals of seeds, have a 1.618 ratio between the diameters of each rotation. This same ratio can be seen in relationships between different components throughout nature.Still don't believe it? Need something that's easily measured? Try measuring from your shoulder to your fingertips, and then divide this number by the length from your elbow to your fingertips. Or try measuring from your head to your feet, and divide that by the length from your belly button to your feet. Are the results the same? Somewhere in the area of 1.618? The golden ratio is seemingly unavoidable.But that doesn't mean that it works in finance … does it? Actually, the markets have the very same mathematical base as these natural phenomena. Below we will examine some ways in which this ratio can be applied to finance, and we'll show you some charts to prove it!The Fibonacci Studies and Finance
When used in technical analysis, the golden ratio is typically translated into three percentages: – 38.2%, 50% and 61.8%. However, more multiples can be used when needed, such as 23.6%, 161.8%, 423% and so on. There are four primary methods for applying the Fibonacci sequence to finance: retracements, arcs, fans and time zones.
1. Fibonacci RetracementsFibonacci retracements use horizontal lines to indicate areas of support or resistance. They are calculated by first locating the high and low of the chart. Then five lines are drawn: the first at 100% (the high on the chart), the second at 61.8%, the third at 50%, the fourth at 38.2% and the last one at 0% (the low on the chart). After a significant price movement up or down, the new support and resistance levels are often at or near these lines. Take a look at the chart below, which illustrates some retracements:
2. Fibonacci Arcs
Finding the high and low of a chart is the first step to composing Fibonacci arcs. Then, with a compass-like movement, three curved lines are drawn at 38.2%, 50% and 61.8%, from the desired point. These lines anticipate the support and resistance levels, and areas of ranging. Take a look at the chart below, which illustrates how these arcs do this:

Conclusion
These Fibonacci studies are not intended to provide the primary indications for timing the entry and exit of a stock; however, they are useful for estimating areas of support and resistance. Many people use combinations of Fibonacci studies to obtain a more accurate forecast. For example, a trader may observe the intersecting points in a combination of the Fibonacci arcs and resistances. Many more use the Fibonacci studies in conjunction with other forms of technical analysis. For example, the Fibonacci studies are often used with Elliott Waves to predict the extent of the retracements after different waves. Hopefully you can find your own niche use for the Fibonacci studies, and add it to your set of investment tools!
Nice post !