Oscillators: how to start off right
Greetings enthusiastic friends of trading and investing in financial markets, as I mentioned earlier my name is Oscar, over a year ago I engage in trading and although I still have a lot to learn (not to mention too much) I come to share some useful information for those who are just starting in this world or those who like me are still in formation.
I hope as always these tips or clues will help you improve your trading, your arsenal of knowledge or put you on the trail of even more interesting things. Today's theme is Oscillators in general.
Oscillators: how to start off right
Oscillators are a type of technical indicator which is normally plotted on its scale below the price chart, its main objective is to help us visualize the momentum in the market and the strength of the trend. The most noted and used are the RSI (Relative Strength Index), the Stochastic and the MACD (Moving Average Convergence/Divergence).
Okay, but what is momentum? In Trading, momentum could be known as the speed which prices in the market can change or how its directionality increases, in a nutshell, the greater momentum, we'll have more decisive changes or movements, and with lower momentum, the market will be more indecisive and flat. Momentum complements quite well with volatility.
It should be noted that oscillators will behave differently depending on what main trend the market is in and at what stage of this it is. Also, when you choose an oscillator, you must consider investigate and understand its calculation and functions, this way you'll know what information regarding the price it's showing you.
Let's look at the most common features of Oscillators and some hints to take advantage of these.
1) Overbought and Oversold levels.
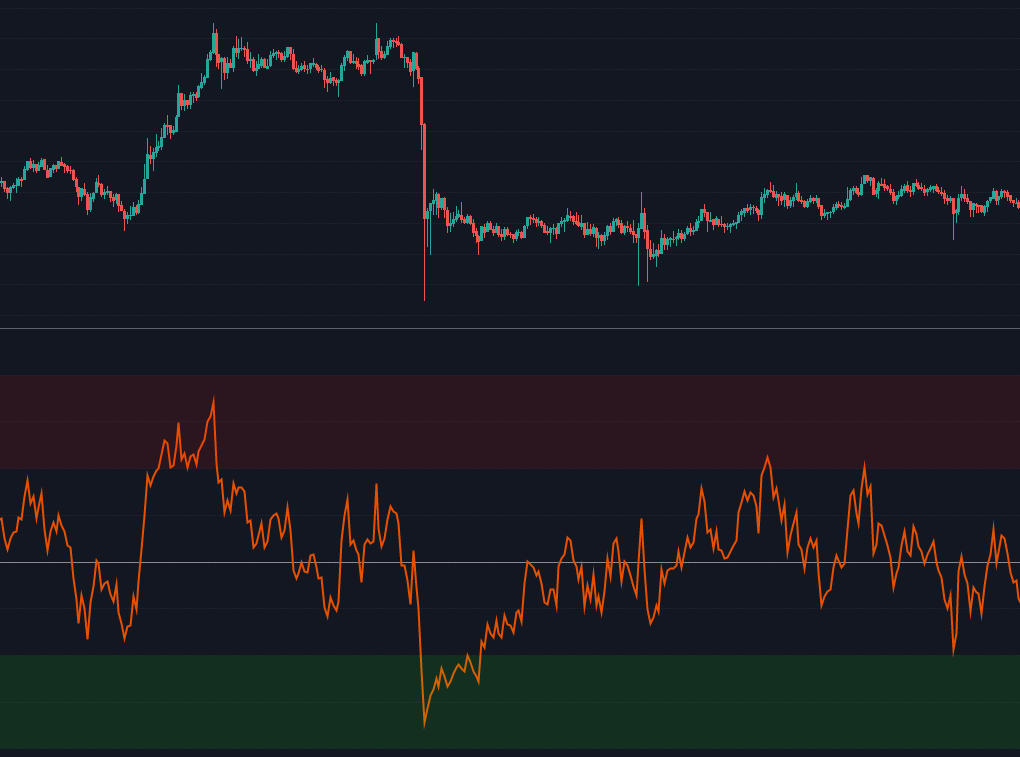
Overbought and oversold levels can be identified in those oscillators that their values have been normalized in a specific range (for example the RSI has values from 0 to 100). These levels indicate the probability of prices going too far in some direction, and therefore must have a correction or a change in the trend may occur.
Overbought and oversold levels are characterized by working very well when the market is in ranges, however, in situations of strong trends they behave differently. The oscillator can repeatedly touch the overbought or oversold level without really suggesting that the price has spread too much.
Besides, because oscillators perform its calculation based on periods, a strong trend makes them sensitive to movements in the opposite direction, and so, for example, causing the oscillator to reach the oversold level easily at the end of a bullish trend, and with misinterpretation, a trader could decide to open long positions at the worst time. So remind, overbought and oversold levels should be used in conjunction with trend analysis and price action.
2) The mid-value or centerline
Another necessary point is Mid Value, as in indicators with both centerlines (such as MACD) and without a centerline (such as RSI and Stochastic) could play an important role in our decisions. We've already seen in the article about RSI that the mid-value or centerline could work as a separator point between bearish impulses and bullish impulses, also when the oscillator crosses this point, it can be interpreted as a momentum point where the market could change the price direction, helping us to set an entry or exit point for a trade, these features will often be seen in different oscillators if we perform a backtest.
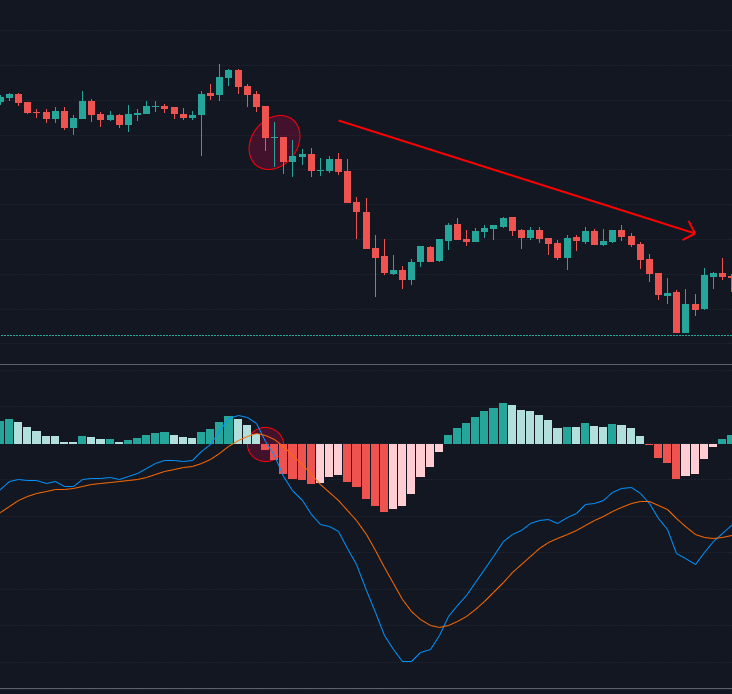
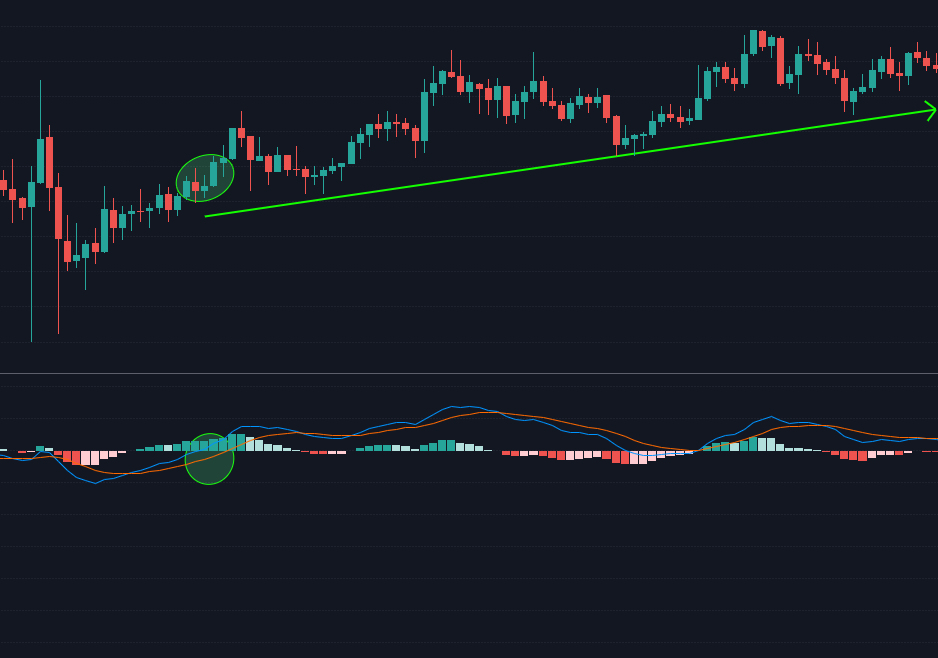
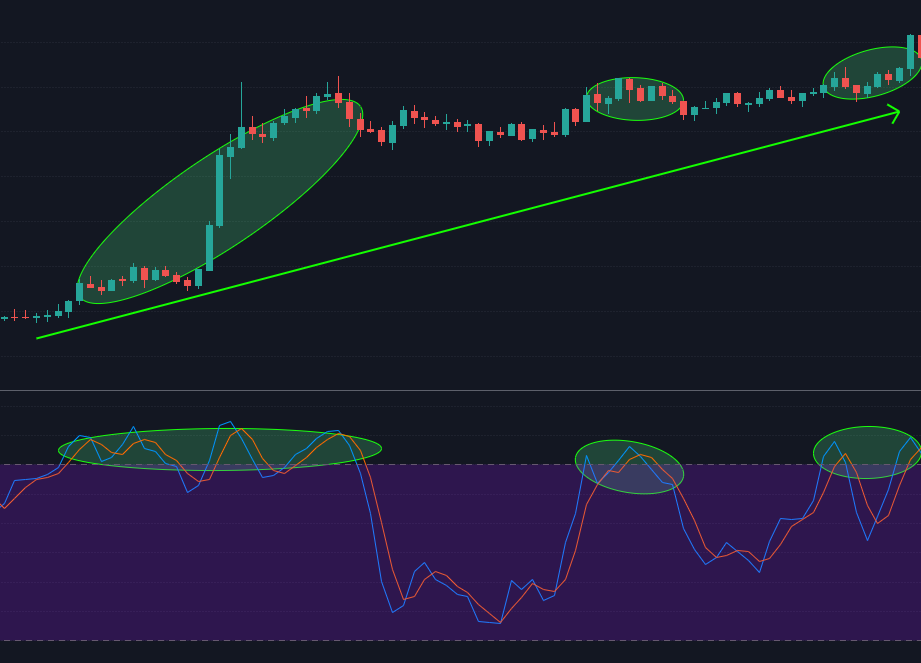
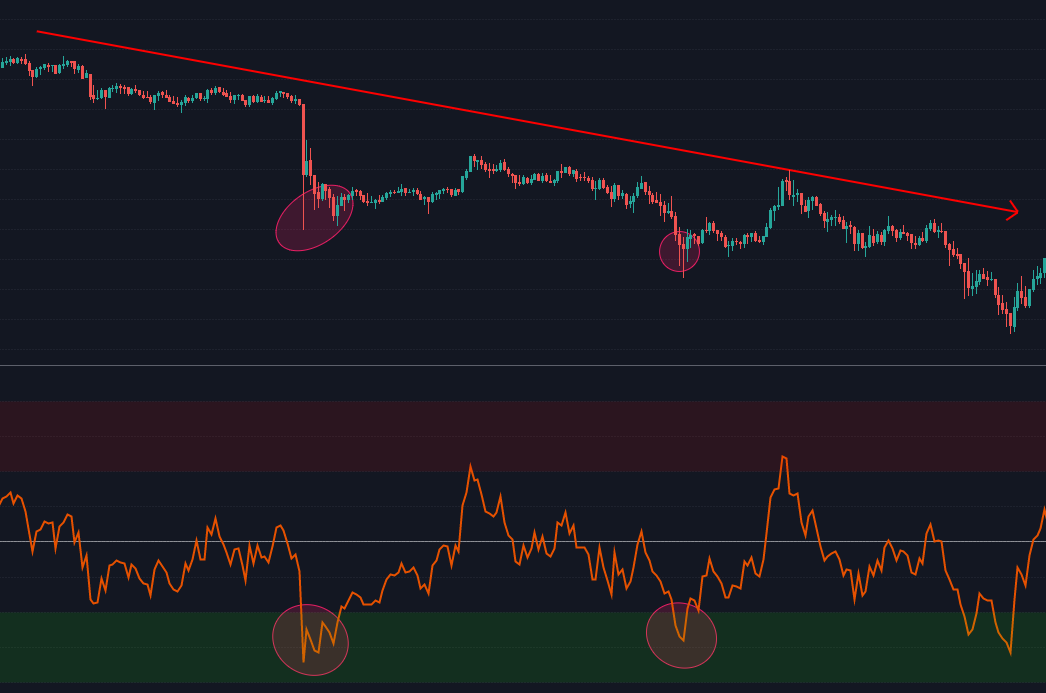
3) Divergences
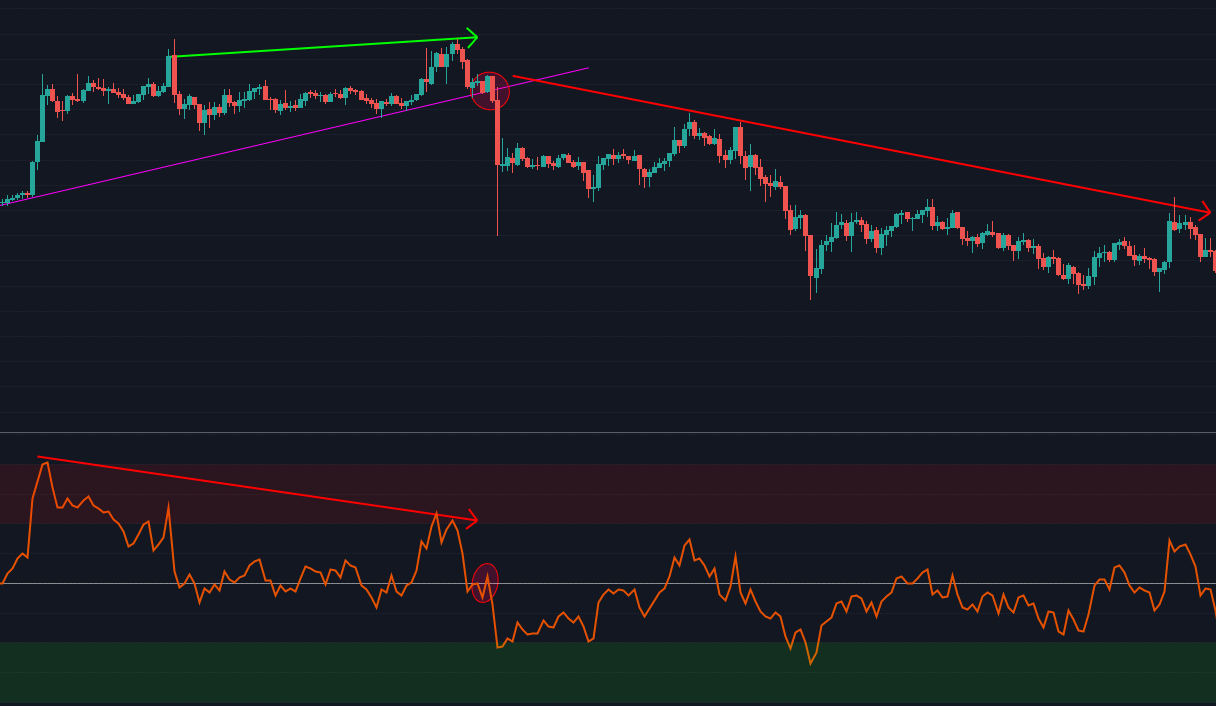
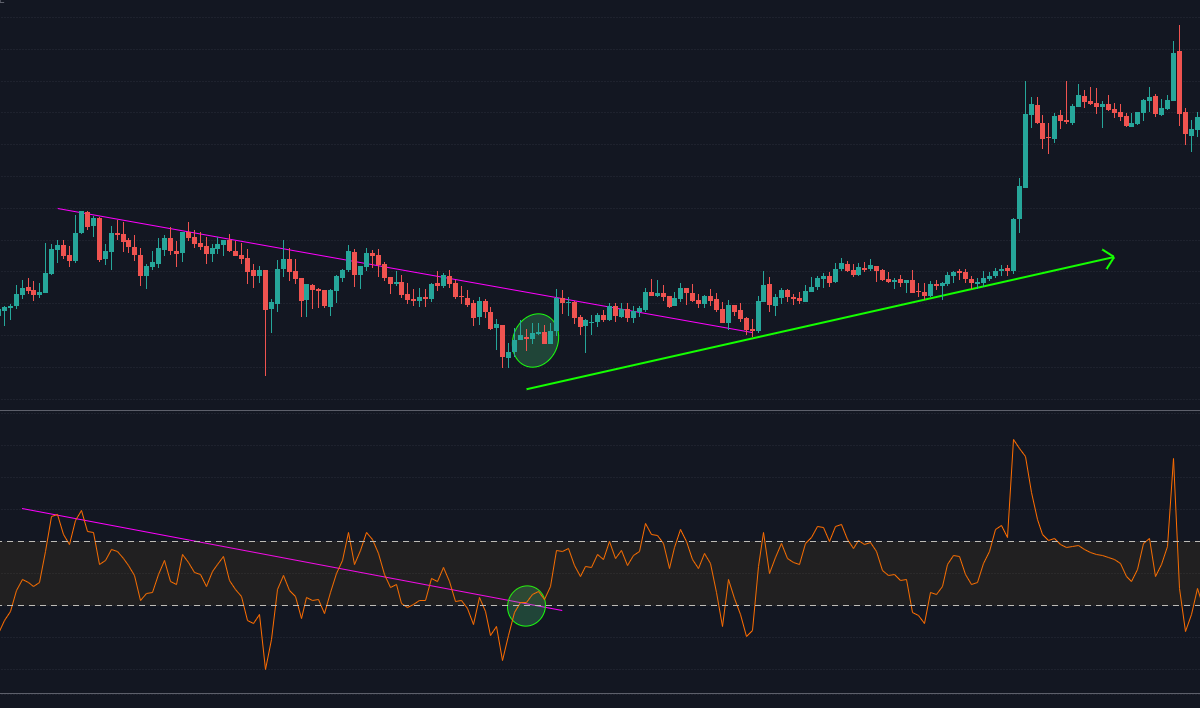
The Divergences also known as wrong oscillations, refer to visual differences that occur between the oscillation in the price chart and the oscillator's chart. For example, in a strong bullish trend, if we notice that the price makes new higher highs, but the oscillator's chart perform lower highs, it reveals a Divergence, warning us of a weakness in the strength of the trend, maybe the time for the market to make a little correction, take a break or in some cases, a change of trend may occur.
The divergences are excellent for putting us on alert, but as you may already thinking, just like everything in trading, it is not 100% accurate, it must be used in conjunction with trend analysis and price action to increase its effectiveness and reduce the likelihood of false signals. Also, there are two types of Divergence (Regular and Hidden), These examples are just for regular divergence cases.
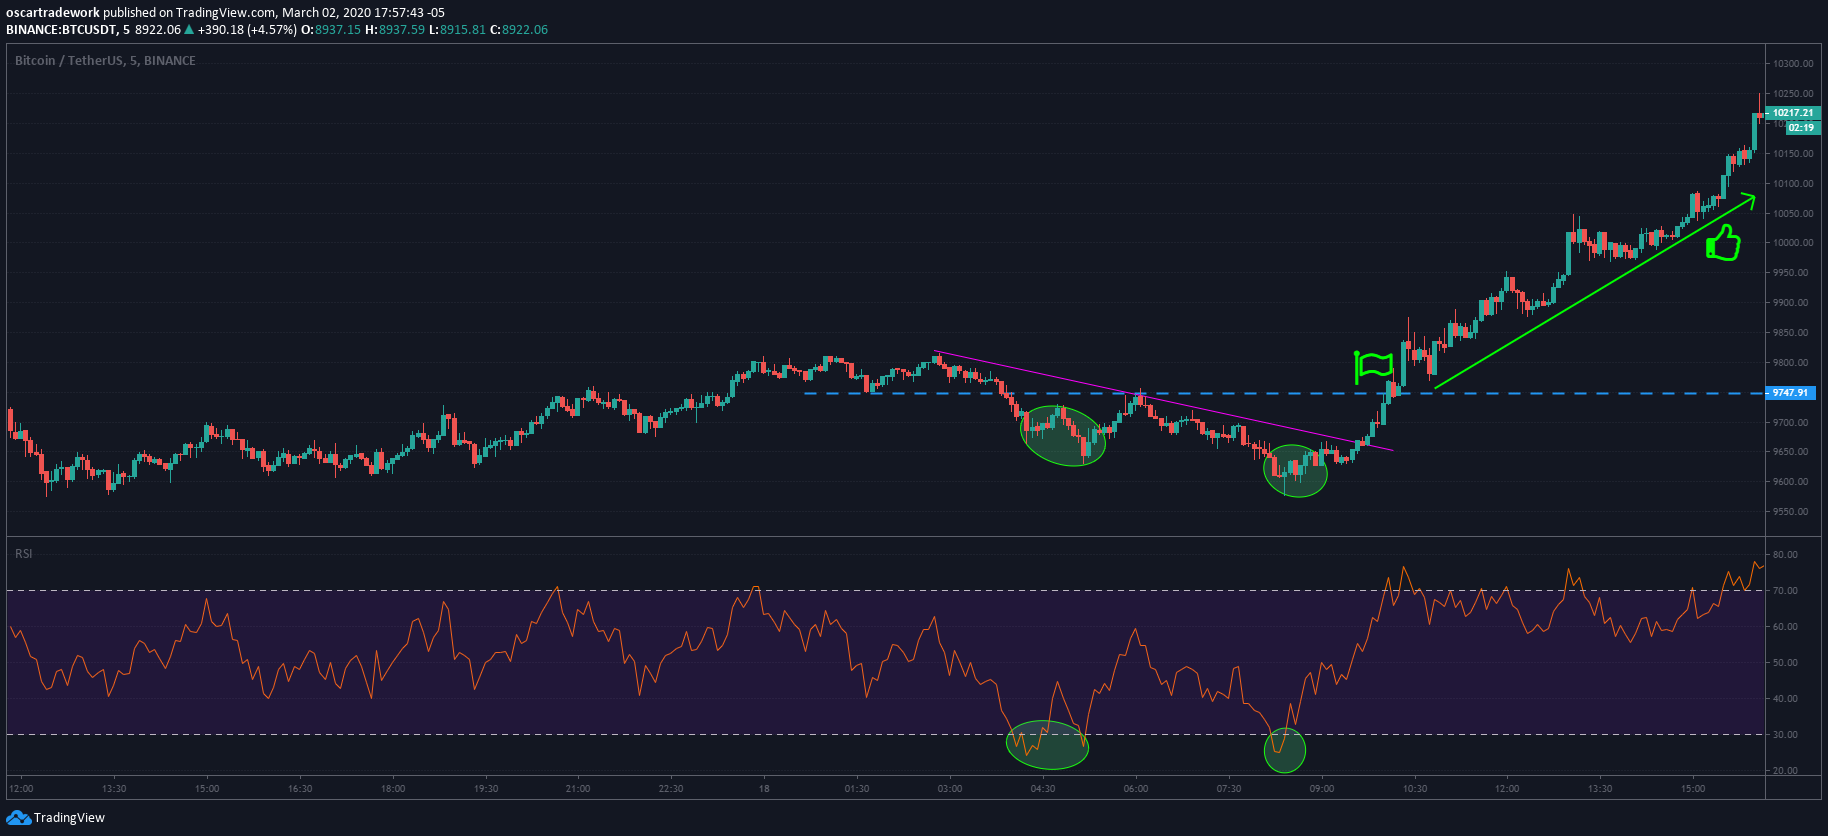
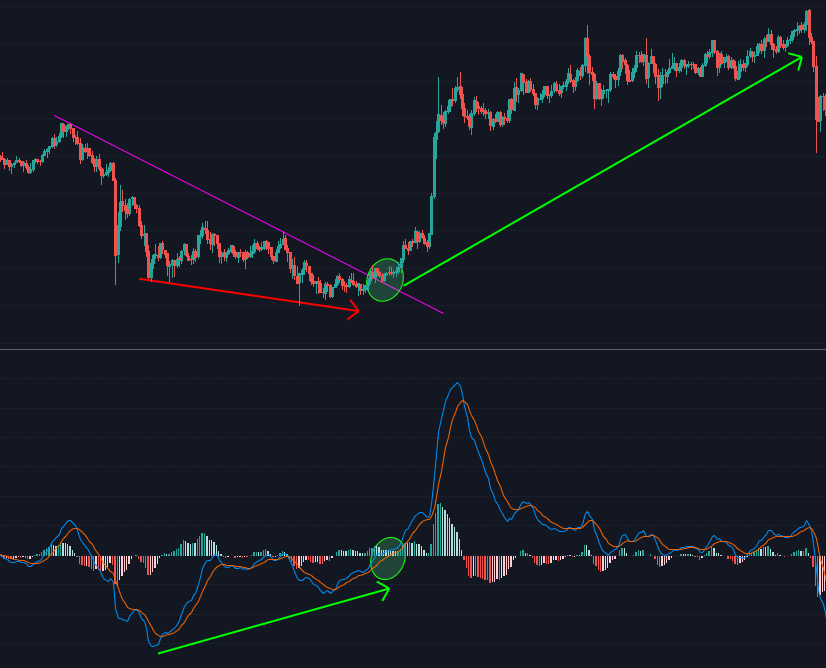
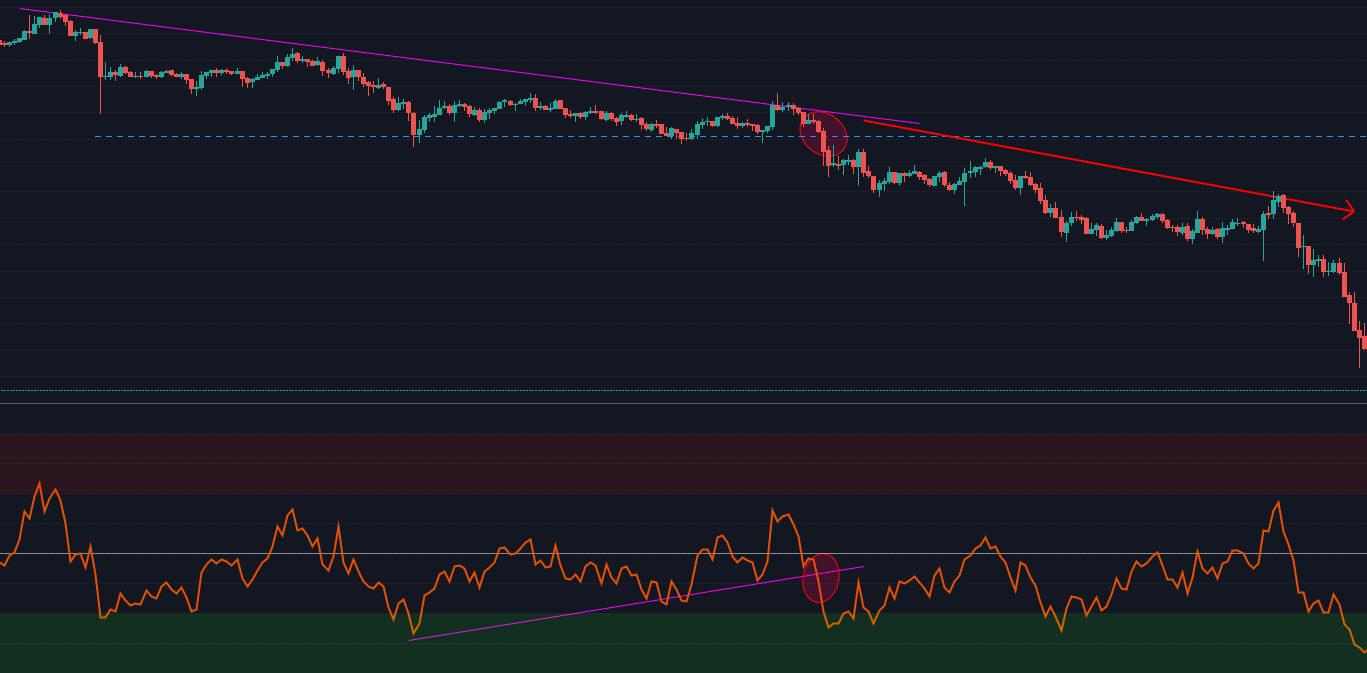
4) Price action on some oscillators.
Due to the type of chart, some oscillators will allow us to perform the same analysis of the price action, identifying trend lines and patterns and thus help us discover hidden signals for our trades or confirmations for our analysis.
Well, that's it, I hope the information has been of some use. If you liked it, don't forget to support me and if you have any suggestions on a topic or think I skipped something important, share it all in the comment box. A hug and if you are in the difficult beginnings, do not give up, persevere, learn and move on.
Main Blog where you will find more useful information: https://steempeak.com/@tradingoz
My Profile on other networks:
Tradingview: https://www.tradingview.com/u/oscartradework/
Uptrennd: https://www.uptrennd.com/user/tradingoz
Somee: https://somee.social/profile/tradingoz/timeline
Steemit: https://steemit.com/@tradingoz
Publish0x: https://www.publish0x.com/@tradingoz
Trybe: https://trybe.one/user/31072
Platform analysis: http://bit.ly/JoinTradingViewHere (Use this link to register and receive a 30$ bonus when you upgrade to a pro plan)
Best Crypto Exchange: http://bit.ly/JoinBinanceBonus (With 10% discount on trading fees)
Came from other place? Join Publish0x here: http://bit.ly/JoinPublish0xHere